All posts by Sung Park
A recent credit study of a regional utility found significant numbers of small businesses with no credit profile despite a history of positive payments.

We get a lot of questions from our customers about blended credit scores vs consumer scores so, for our latest Fast FUNdamentals session, I thought it would be helpful to share what makes blended scores so powerful, and something you should consider when granting credit to small businesses. Watch our video or read the post, and remember to share it with your friends and colleagues. Small business growth fuels the U.S. economy through job creation and innovation! Small businesses support regional and local economies throughout the country, with higher proportions in middle America, and for every Walmart, Amazon, and Google, there are thousands of small business manufacturers, distributors, resellers, and app developers supporting their growth as well. In order to grow, small businesses need good ideas, a good business plan, hard work, and access to capital. Good credit is required to access capital, and many creditors look at the business owner’s consumer credit information from bureaus like Experian, to determine creditworthiness and credit risk. They tend to see small businesses and small-business owners as one and the same. However, this strategy is not always successful. The average consumer profile is quite different from the average business owner. Let’s look at how the profiles compare on some general consumer attributes associated with credit risk. The average owner has more trade experiences and has a longer credit history, which indicate lower risk. However, the owner also has higher credit utilization, which commonly indicate higher risk. Does this mean that the average owner is a higher credit risk than the average consumer? Not necessarily. Many small business owners rely to an extent on their personal credit to help finance their business. For public records, such as tax liens, judgments, and bankruptcies, the average is low for both the average consumer and owner. For collections, the average consumer has 5 times the amount to that of the owner. That’s indicative of higher risk. Another major indicator of credit risk is severe payment delinquency, and again, the average consumer is much more likely to be more severely delinquent than the average owner. Given that the average business owner looks and behaves differently from the average consumer, is there a better way to assess small business credit risk? A better way to assess small business risk Experian conducted a study to look at the relationship between the business and the owner’s credit behaviors over 3.5 years, to determine the strength of that relationship. We tracked the percentage of those businesses and owners that continued to remain credit active and healthy, and those that became high credit risks, becoming 91+ days delinquent on over 35% of all trade obligations. Over 3.5 years, 79% of the time, both the business and owner’s credit remained healthy. We tracked the percentage of those businesses and owners that continued to remain credit active and healthy, and those that became high credit risks, becoming 91+ days delinquent on over 35% of all trade obligations. Over 3.5 years, 79% of the time, both the business and owner’s credit remained healthy, and 5% of the time, both the business and owner became severely delinquent on the business obligations and on the personal credit obligations. That means that 84% of the time, the end result of business and consumer credit is the same! That’s a very strong correlation, so the owner’s consumer credit behavior is very indicative of business credit behavior. But, that also means that 16% of the time, the outcome of the business and consumer are diametrically opposed. 9% of the time, the business goes bad, but the owner stays good. If a creditor were to approve a business for credit based on the owner’s credit profile, the creditor would have made a bad decision. Furthermore, 7% of the time, the consumer goes bad but the business stays good. Blended risk scores provide better commercial risk assessment Blended risk scores predict business risk by utilizing the owners’ consumer credit attributes with the business credit attributes together – to calculate a more comprehensive risk score for the business With the blended risk score, creditors can more confidently approve those with a great score and know that they will have a profitable customer. And they may have to decline those with a high-risk score to mitigate against future loss. Let’s compare the predictive power of three risk models as the business ages, from infancy to full maturity In the below illustration, the horizontal axis going across measures the business as it ages, from 0 to 2 years on left, to 21+ years old on the right. The risk models compared are the Blended model, Commercial only model and Consumer model. Again, the Blended model uses both the business and consumer credit information to calculate the business risk. The Commercial only model uses just the business credit data to predict business risk and the Consumer model uses consumer credit data to assess the risk of the consumer, which is the business owner. The vertical axis measures KS, which is a metric representing the predictive power of each model in accurately identifying future good vs bad business credit outcomes. The KS is scaled from 0 to 100, with 0 indicating no predictive power and 100 Indicating perfect prediction. So, higher values indicate stronger model performance. For businesses in infancy up to 2 years, the Consumer risk score is more predictive of business risk than the Commercial risk score. That may seem counter-intuitive, but the underlying reason is that new and young businesses do not have a lot of credit activity on their profile. Many young businesses are actually funded by the owner’s personal credit, so there is less business credit information to calculate the business score. And in general, the less information available, the less predictive a model score will be. As the business matures, it establishes and expands its credit profile, opening more tradelines in the name of the business. As the business profile becomes richer in information, the commercial risk becomes more predictive than the consumer score. The business becomes a separate entity, and the consumer score becomes less and less indicative of business risk. Behaviors can differ dramatically from the business owner, as we have seen in previous examples. As expected, across all the ages of the business, the blended score provides superior performance. The blended score takes the age of the business into consideration as one of the factors for calculating risk, at every stage of the business lifecycle, the blended score provides a more holistic risk of the business by integrating the dynamic relationship between the business and owner credit profiles. Small business owners represent a unique market. They have an evolved sense of purpose, discipline, and responsibility that allows them to accept the risks and hardships required to build an enterprise from the ground up. To properly evaluate an entrepreneur’s credit risk, creditors must look at the right score. Utilizing a blended score is a proven, better way for creditors to evaluate risk and extend worthy businesses the capital they need to grow and prosper. And, as small businesses succeed, we all benefit.
Credit risk scores predict credit risk in the near future, based on the credit profile of the business as of today. So you have a new applicant. What do you do? You get that credit risk score for those applicants with a great score; you're going to approve them and hope they'll be good customers for life. For those applicants with a high-risk score, you may have to decline them. This is the way it's supposed to work, but how do you know if the risk score works for your portfolio? What is the risk associated with the score specifically for you? To understand the risk of the score for your applicants, you can start scoring all new applicants as of today and wait 3, 6, 12 months. But who has the time to wait a year to see if the score predicts good versus bad outcomes accurately? Watch our Fast FUNdamentals Video A more immediate way is to score the newly booked accounts from a year ago and compare the score at application with the performance up to today. This process is called model validation. It's possible because Experian archives a snapshot of all business credit profiles and scores monthly going back more than a decade. Model validation results are represented through a performance table or odds chart. Let's go over a simple model validation odds chart. The risk score is scaled from 1 to 5, with 5 indicating the lowest risk and 1 indicating the highest risk. Younger businesses, businesses with minimal credit experience, or companies with severe delinquencies or collections would score low. This table shows the number of accounts that got each risk score. These columns show the number of accounts that say good or went bad within the first 12 months of account opening at the point of application. This is the bad rate for each score by knowing what the risk of the score is for your portfolio. You can understand the risk of new applicants going forward. A common metric used to determine a risk score's predictive power is KS named for its craters, Kolmogorof and Smirnoff. KS measures a score's ability to separate two populations. In this case, future goods and future bads. If more bads get lower scores and more goods get high scores, then the model is doing an excellent job of predicting credit risk. Let's quantify how good the model is performing by calculating KS. We see that 20 accounts got the worst score - a 1, and 12 of these accounts stayed good within one year of opening, and eight of these accounts went bad within one year of opening. Now let's add some columns that calculate values from the worst score on up. These are called the cumulative calculations. At the worst score of 1 there are eight bads captured out of 20 total bads, which is 40% of all bad accounts. At the score of 1 to 2 there are 14 bads captured out of 20 total bads, which is 70% of all bad accounts. At the score of 1 to 3 there are 17 bads captured out of 20 total beds, which is 85% of all bad accounts. Finally, at score of 1 to 5, there are 20 bads captured out of 20 total bads, which is 100% of all bad accounts. We go through the same calculations for the percentage of good captured. Let's calculate that KS now. At each score range, we subtract the percentage of goods captured from the percentage of bads captured. The KS is just the maximum difference between the percentage of bads captured and the percentage of goods captured. The KS is scaled from 0 to 100 with 0 indicating no ability to predict good versus bad outcomes, and 100 indicating perfect prediction. Let's see a model that can not predict credit risk at all. This model captures the same percentage of goods and bads at each score. So the maximum KS is zero. Now let's see how a model can get to a KS of 100. There it is, all bads got the worst score of 1 and no goods. All right, now that we understand how well the risk score predicts risk, let's discuss how we can apply your odds charts, make data-driven decisions. Let's say on average, you make $100 dollars on every excellent account, but you lose $200 for every bad. For each score we calculate the net profit by multiplying the number of goods by profit per good. Net loss by multiplying the number of bads by loss per bed. Now let's calculate the cumulative net profit and loss from best to worst score. We're simply summing the net profit and net loss amount as we go from a score of 5 down to 1. Lastly, we subtract the cumulative net loss from net profit at each score to determine the score cut. To maximize profit for all the accounts that score a 5, we're making a profit of $1,700. As we add lower-scoring accounts, our maximum profit continues to increase. When we add the accounts at score 1, the maximum profit decreases by $400. This means that we maximize profit by approving everyone that scores 2 and higher. For those that score 1, there are 20 accounts, and we're losing $400 from them. We can choose to decline them or charge them a deposit of $20 or more to be profitable because we're losing $20 on average per account here.
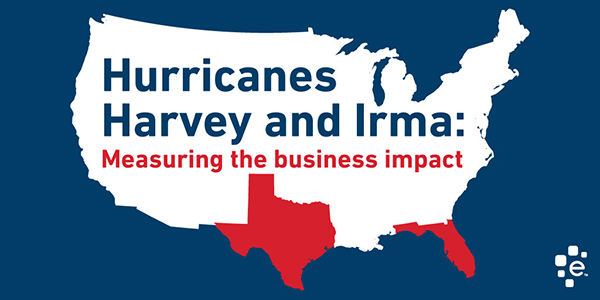
Within the span of two weeks, two states in the Southeast - Texas and Florida, have been devastated by two category 5 hurricanes. It has been over a decade since the United States last fell victim to another category 5 hurricane, Katrina, which submerged New Orleans under 20 feet of water and displaced 1.3 million people to find shelter anywhere and everywhere across the U.S. However, within one year, New Orleans would see 66% of its pre-Katrina population return, and sales tax revenue climb to 84% of pre-Katrina levels.The road to recovery will no doubt be arduous, but there is also no doubt that the resilient people of these states are already marching steadfastly on that road. The recovery effort is supported by FEMA, the U.S. Federal Emergency Management Agency, which has already approved $124 million to support individuals and households in Florida and $408 million to support those residents impacted in Texas. Along with direct support for its people, the U.S. government is accepting and approving SBA loans for businesses impacted by Hurricane Irma and Harvey. As residential rebuilding plans begin, many of the people living in these regions are also employees and business owners whose places of work may also need weeks or months to rebuild, if they rebuilt at all. How quickly the area’s economy recovers has obvious implications for the people and businesses in the region, but it also has far-reaching implications for businesses that depend on the region as a source of revenue as well. Experian is looking to its wealth of business credit data to gauge the overall magnitude of the disaster and the impact to regional businesses. Nearly 1.5 million businesses in Texas are in FEMA declared Hurricane Harvey impacted counties. This represents one in three businesses in all of Texas. The businesses impacted have $10 billion in outstanding payables and represents 31% of all commercial payable balances in Texas. The businesses in the impacted regions, on average, have very similar credit profiles to the rest of the businesses in Texas, with the typical business being 10 years old, paying 7 days late, and having an Intelliscore Plus commercial credit score of 41 out of 100. In Florida, nearly all of the state has been enveloped by Hurricane Irma. 3.9 million businesses reside in Irma impacted counties, accounting for nine out of ten businesses in Florida. These impacted businesses represent 91% of total outstanding commercial payables in Florida, summing to over $26.6 billion. That is over two and a half times higher the balance potentially at risk in Texas. As of August 2017, $3 billion of the payables are delinquent, and as most businesses focus on recovery, these delinquent dollars may slide into further delinquency. Businesses in Florida are, on average, slightly over 10 years old, pay 8 days late, and have an Intelliscore Plus score of 41. From an industry sector point of view, professional and business services were hardest hit in both states, with these businesses accounting for over 40% of all businesses impacted for each state, respectively. In Texas, professional and business services owe $2 billion in payables. In Florida, businesses in this sector carried over three times that balance, owing $6.5 billion in payables, with over $700 million already delinquent. In Texas, other industry sectors significantly affected include construction and retail trade, each accounting for 16% of businesses in the impacted region, and having $7.6 billion and $9.6 billion in total payables, respectively. In Florida, retail trade businesses represent 18% of all businesses affected, and account for $2.9 billion in commercial trade balance owed. Businesses in finance, insurance, and real estate account for 12% of businesses in the impact zones, and owe $1.7 billion in outstanding balance. Construction businesses in Florida represent nearly 10% of businesses affected. As Florida has a smaller percentage of businesses in the construction industry overall compared to Texas (10.1% vs 14.5% respectively), and 90% of construction businesses in Florida are in designated impact counties, Florida may require more assistance from outside the state to support their rebuilding effort. Smaller and younger businesses in general face lower odds of continued prosperity, and these businesses are the most susceptible to the devastation of Hurricane Harvey and Hurricane Irma. The impacted areas for both states are dominated by smaller businesses, with nearly 90% of businesses having four or less employees, and almost 100% having less than 50 employees. Even though they are small, these businesses account for $8.7 billion, or 86% of payables impacted, in Texas. In Florida, these small businesses total $23.8 billion in payable balance, which constitutes 90% of all impacted payables. Many of these small businesses are young, but Florida businesses are more mature than businesses in Texas. In Florida, 3.5 businesses out of 10 have been credit active for less than six years, compared to 4 out of 10 businesses in Texas. These young businesses in Texas owe a total of $2.7 billion, while young businesses in Florida owe two and a half times that amount, at $6.9 billion. Over the next several months, Experian will measure the financial impact of businesses caught in the devastating path of Hurricanes Harvey and Irma. We will track changes in key metrics that can provide insight into the level of progression of recovery by location and type of business. Businesses integral to the recovery efforts, such as home improvement suppliers, construction companies, sanitary service companies, and the workers they employ, will undoubtedly prosper as their products and services are immediately in demand and in short supply.Younger businesses and businesses in more severely impacted regions will have a difficult road ahead. We will continue to track credit activity, such as changes in spend, utilization, new trade openings, and payment delinquency trends, to identify business sectors and profiles that appear to be rebounding, and those in further need of assistance. Subscribe to our blog for the latest updates on the business recovery progress from Hurricanes Harvey and Irma.
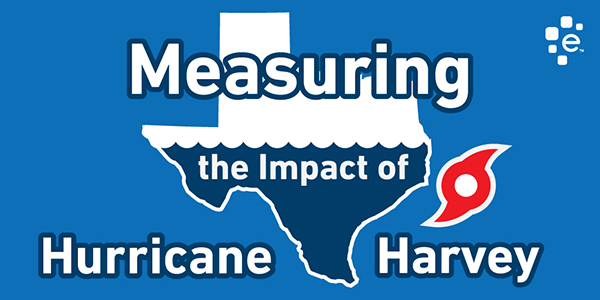
As the recovery gets underway, it will take months to assess the full economic impact of the unprecedented devastation brought to South Texas by Hurricane Harvey. Thousands of residents have been displaced, and as food and shelter are delivered and residential rebuilding plans begin, many of these people are also employees and business owners whose places of work may also need weeks or months to rebuild, if they will be rebuilt at all. How quickly the area’s economy recovers has obvious implications for the people and businesses in the region, but it also has farther-reaching implications for businesses that depend on the region as a source of revenue as well. Experian looked to its wealth of business credit data to gauge the overall magnitude of the disaster and the impact to regional businesses. Nearly 1.5 million businesses in Texas are in FEMA declared Hurricane Harvey impacted counties. This represents one of three businesses in all of Texas. The businesses impacted have $10 billion in outstanding payables and represent 31% of all commercial payable balances in Texas. The businesses in the impacted regions, on average, have very similar credit profiles to the rest of the businesses in Texas, with the typical business being 10 years old, paying 7 days late, and having an Intelliscore Plus commercial credit score of 41 out of 100. Statistics for areas impacted Texas Impacted Impact % TX Number of businesses 4,823,364 1,411,583 29.27% Total balances $ 32,334,156,000 $ 10,014,029,400 30.97% Bal 1-30 $ 1,630,010,705 $ 515,641,208 31.63% Average utilization 26.22 27.34 Average IPV2 Score 40.93 40.54 From an industry sector point of view, professional and business services were hardest hit, with these businesses accounting for over 40% of all businesses impacted. Professional and business services owe $2 billion in payables. Other industry sectors significantly affected include construction and retail trade, each accounting for 16% of businesses in the impacted region, and having $7.6 billion and $9.6 billion in total payables, respectively. Impacted Businesses by Industry Smaller and younger businesses in general face lower odds of continued prosperity, and these businesses are the most susceptible to the devastation of Hurricane Harvey. The impacted areas are dominated by smaller businesses, with nearly 90% of businesses having four or less employees, and almost 100% having less than 50 employees. Even though they are small, these businesses account for $8.7 billion, or 86% of payables impacted. Many of these small businesses are young, and there are two in five businesses in the impacted counties that have been credit active for less than six years. These young businesses owe a total of $2.7 billion, or 27% of outstanding payables. Impacted Businesses by Company Age Over the next several months, Experian will show the level of progression of recovery by location and type of business. To be informed when we post about this topic, subscribe to our blog.