Business Information Blog

Credit Management

Credit Management

Reports & Scores

Business Credit Reports and Scores

Data & Analytics

Data and Analytics


The latest from our experts

Loading…
Small-business credit expands heading into year-end, and another round of COVID-19

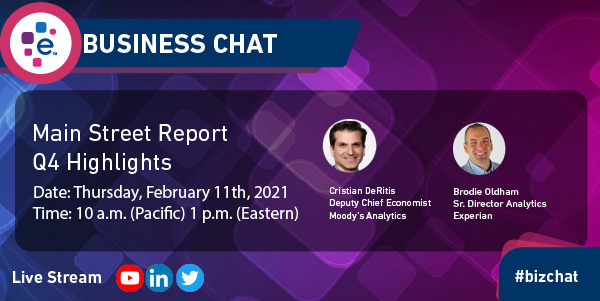
Experian and Moody's Analytics have just released the Q3 2020 Main Street Report. The report brings deep insight into the overall financial well-being of the small-business landscape, as well as offer…

Nov 19,2020 by

Understand and Use a Business Credit Risk Score – 5-minute FUNdamentals

Credit risk scores predict credit risk in the near future, based on the credit profile of the business as of today. So you have a new applicant. What do you do? You get that credit risk score for those applicants with a great score; you're going to approve them and hope they'll be good customers for life. For those applicants with a high-risk score, you may have to decline them. This is the way it's supposed to work, but how do you know if the risk score works for your portfolio? What is the risk associated with the score specifically for you? To understand the risk of the score for your applicants, you can start scoring all new applicants as of today and wait 3, 6, 12 months. But who has the time to wait a year to see if the score predicts good versus bad outcomes accurately? Watch our Fast FUNdamentals Video A more immediate way is to score the newly booked accounts from a year ago and compare the score at application with the performance up to today. This process is called model validation. It's possible because Experian archives a snapshot of all business credit profiles and scores monthly going back more than a decade. Model validation results are represented through a performance table or odds chart. Let's go over a simple model validation odds chart. The risk score is scaled from 1 to 5, with 5 indicating the lowest risk and 1 indicating the highest risk. Younger businesses, businesses with minimal credit experience, or companies with severe delinquencies or collections would score low. This table shows the number of accounts that got each risk score. These columns show the number of accounts that say good or went bad within the first 12 months of account opening at the point of application. This is the bad rate for each score by knowing what the risk of the score is for your portfolio. You can understand the risk of new applicants going forward. A common metric used to determine a risk score's predictive power is KS named for its craters, Kolmogorof and Smirnoff. KS measures a score's ability to separate two populations. In this case, future goods and future bads. If more bads get lower scores and more goods get high scores, then the model is doing an excellent job of predicting credit risk. Let's quantify how good the model is performing by calculating KS. We see that 20 accounts got the worst score – a 1, and 12 of these accounts stayed good within one year of opening, and eight of these accounts went bad within one year of opening. Now let's add some columns that calculate values from the worst score on up. These are called the cumulative calculations. At the worst score of 1 there are eight bads captured out of 20 total bads, which is 40% of all bad accounts. At the score of 1 to 2 there are 14 bads captured out of 20 total bads, which is 70% of all bad accounts. At the score of 1 to 3 there are 17 bads captured out of 20 total beds, which is 85% of all bad accounts. Finally, at score of 1 to 5, there are 20 bads captured out of 20 total bads, which is 100% of all bad accounts. We go through the same calculations for the percentage of good captured. Let's calculate that KS now. At each score range, we subtract the percentage of goods captured from the percentage of bads captured. The KS is just the maximum difference between the percentage of bads captured and the percentage of goods captured. The KS is scaled from 0 to 100 with 0 indicating no ability to predict good versus bad outcomes, and 100 indicating perfect prediction. Let's see a model that can not predict credit risk at all. This model captures the same percentage of goods and bads at each score. So the maximum KS is zero. Now let's see how a model can get to a KS of 100. There it is, all bads got the worst score of 1 and no goods. All right, now that we understand how well the risk score predicts risk, let's discuss how we can apply your odds charts, make data-driven decisions. Let's say on average, you make $100 dollars on every excellent account, but you lose $200 for every bad. For each score we calculate the net profit by multiplying the number of goods by profit per good. Net loss by multiplying the number of bads by loss per bed. Now let's calculate the cumulative net profit and loss from best to worst score. We're simply summing the net profit and net loss amount as we go from a score of 5 down to 1. Lastly, we subtract the cumulative net loss from net profit at each score to determine the score cut.  To maximize profit for all the accounts that score a 5, we're making a profit of $1,700. As we add lower-scoring accounts, our maximum profit continues to increase. When we add the accounts at score 1, the maximum profit decreases by $400. This means that we maximize profit by approving everyone that scores 2 and higher. For those that score 1, there are 20 accounts, and we're losing $400 from them. We can choose to decline them or charge them a deposit of $20 or more to be profitable because we're losing $20 on average per account here.

Nov 18,2020 by Sung Park

Overcoming regulatory roadblocks in machine learning models

The concept of machine learning has been around for 50+ years in analytic circles. But machine learning methods have created a stir in the last few years as their popularity and visibility increased in the U.S. consumer and commercial credit industry.

Oct 05,2020 by

Creating a World-Class Supplier Risk Management Program: Essential Strategies and Components

Supplier risk management has become a top priority for procurement and supply chain professionals. With rising regulatory and compliance fines and the global market disruptions caused by trade wars and the pandemic, a robust supplier risk management program is crucial. Gerard Smith, President and Co-founder of Global Risk Management Solutions, shares insights on creating a world-class supplier risk management program. In this interview, discover the essential components and strategies to effectively manage supplier risk and ensure compliance and stability in your supply chain. Evolution of Supplier Risk Management Practices Twenty years ago, when I was in procurement, many organizations self-performed everything. In other words, they collected documents and validated them as best as they could. The issue today is with COVID. With COVID, many companies are concerned. The two things we keep hearing about is the financial stability of the suppliers. Are they financially stable? Not only today, but in the foreseeable future, and secondarily, do they have insurance to protect the client company if there are any errors. So, it's the financials currently, and the insurance companies are most concerned about monitoring. Increasing Complexity in Supplier Risk Management Companies are starting to source globally, and more and more companies are concerned about the supply chain and if there are issues, whether geopolitical or whatever the case may be. So the idea here is to manage supplier risk proactively, and so there are three components of that. First, based on a client's requirements – the ability to do the risk assessment based on specific risk components. Second, having a help desk to try and troubleshoot where there are issues with the suppliers to help them to get into compliance. And third, most importantly, being able to monitor those suppliers for changes in status and getting actual push alerts, to be able to act on those. So, in other words, getting in front of the problem versus finding out that a supplier perhaps filed bankruptcy or showed up on a government watch list or something like that. Key Components of a World-Class Supplier Risk Management Program If a company wishes to have a world-class supplier risk management program, there are five crucial components that you would want to see, they are: Customized Risk Program A Customized Risk Program is tailored to address specific risk components relevant to a company's unique needs. This customization can take various forms: Geographical Considerations: Different regions, such as EMEA (Europe, Middle East, and Africa) and APAC (Asia-Pacific), have distinct regulatory requirements and market conditions. A Customized Risk Program can adapt to these regional differences, ensuring compliance and appropriate risk management practices in each area. Spending Levels: Companies often have both strategic and non-strategic suppliers. Strategic suppliers, with whom the company spends more, may require a more thorough and detailed risk assessment compared to non-strategic suppliers. Customizing the risk program based on spending levels ensures that critical suppliers are monitored more closely. Specific Risk Factors: Different industries and companies face unique risks. Whether it's financial stability, compliance with specific regulations, or reputational risks, a Customized Risk Program can focus on the most relevant risk factors for the company. The key objective of a Customized Risk Program is flexibility. It must be able to adapt to various factors such as geography, spending, and specific risk elements, ensuring it is not a one-size-fits-all solution but rather a bespoke approach to managing supplier risk effectively. Adjudicating Information This involves the critical process of verifying and clarifying data to ensure accuracy. This means systematically identifying and eliminating false positives, which occur when incorrect or irrelevant information is selected. For instance, if you input "Bob's Plumbing" into a database, you might receive numerous results for companies with similar names. The challenge is to determine which "Bob's Plumbing" is the correct one that your company works with. Adjudicating information requires sophisticated methods to accurately select the correct entity and cross-verify the details, ensuring that the data is precise and applicable to your specific supplier. This process is essential for maintaining the integrity and reliability of your supplier risk management program. Reporting In a supplier risk management program, reporting capability is vital for maintaining consistent and measurable compliance standards. This involves generating real-time, standardized reports that provide current risk ratings for all suppliers. With these reports, management can quickly identify which suppliers are in compliance with set standards and which are not, along with the reasons for non-compliance. Additionally, the reports highlight any ongoing issues within the supply chain, enabling management to address problems promptly. Effective reporting ensures transparency, accountability, and the ability to make informed decisions based on up-to-date risk assessments. Document Verification and Monitoring In a supplier risk management program, Document Verification and Monitoring is crucial for ensuring the authenticity and accuracy of the documents submitted by suppliers. While collecting and managing documents can be straightforward, the challenge lies in verifying their validity. Many procure-to-pay, source-to-pay, and ERP platforms face this issue, as they often rely on suppliers to upload documents without proper verification. This can result in the acceptance of invalid or even blank documents. To address this, a robust system or process must be in place to validate key documents such as certificates of insurance, W9 forms, and other critical documentation. This system should not only collect documents but also authenticate them, ensuring they meet the required standards and are current. Continuous monitoring of these documents is essential to maintain compliance and mitigate risks associated with outdated or fraudulent information. By implementing thorough document verification and monitoring, companies can ensure the integrity of their supplier risk management program. Continuous Monitoring Continuous Monitoring refers to the ongoing, real-time oversight of supplier activities and conditions to promptly identify and address potential risks. A primary focus of continuous monitoring is assessing the financial stability of suppliers. This means regularly evaluating their financial health to detect any signs of trouble. If a supplier shows indications of financial distress, such as declining financial metrics or negative market signals, the company can take proactive measures, such as halting purchase orders, to prevent potential disruptions in the supply chain. Continuous monitoring ensures that companies can swiftly respond to changes in a supplier's status, maintaining the reliability and integrity of their supply chain operations. Critical Risk Components for Effective Supplier Risk Management There are eight different risk categories. The risk components that companies should at least address within their program. Financial Stability Financial stability is monitoring financial stability in real-time and be able to identify if there are issues whether they are getting in worse financial shape or perhaps getting in better financial shape. Digital Insurance Verification The best practice right now is what's called digital insurance verification. We're able to manage insurance coverage electronically. We don't even have to collect a certificate of insurance anymore. We can do it digitally in North America. That means that we can monitor a supplier to ensure that they continue to have the insurance requirements daily, which is a unique situation. So you want to make sure, at a minimum, you collect the certificate of insurance. If you want the best practice, you do digital insurance verification. Reputational Protection We do global adverse media monitoring. So as an example, we manage over 25,000 media sources around the globe looking for negative stories because you want to know if your supplier is caught with child labor, or if they've closed a facility somewhere in the world that you're reliant upon. So adverse media is very big at this point because things are evolving very quickly. Regulatory Compliance Regulatory compliance is basically anything that's government regulation. So, it could be the various sanctions lists. Most people don't recognize there are over 1500 watch and sanctions lists around the globe including the U.S OFAC list. That's a big one. It can be a Conflict Minerals Declaration, U.K. Modern Slavery Act, Reach ROHS, the California Transparency Act, anything that's a government regulation falls into that category. Cyber Security Cyber Security would be anything that's involved with data and document verification. It has to be able to collect and validate not only the documents such as a code of conduct, but documents with an expiration date such as an NDA or a diversity certificate. Any standardized documents should be part of the program so suppliers don't get continuously contacted for more documents. Social Responsibility Social responsibility could be anything from diversity verification, child labor, those types of things. Document Management Validate key documents such as certificates of insurance, W9 forms, and other critical documentation. This system should not only collect documents but also authenticate them, ensuring they meet the required standards and are current. Continuous monitoring of these documents is essential to maintain compliance and mitigate risks associated with outdated or fraudulent information. Health and Safety Finally, health and safety could include an HSC questionnaire,  EMR ratings, or OSHA statistics. Those are eight areas that companies should at least consider looking into as far as potential risk components. Obviously, there are different parts of each, one of those where those are the broad categories. Global Supplier Risk Assessments: Reliability and Challenges Dependingon what country we're speaking of. Is the information available? Yes, there are varying degrees of information. You can get more information in North American and EMEA than you can say in APAC or South America. Is it available? Absolutely. We can do a supply risk assessment in over 120 countries. So, it is possible to get information. There is standardized information in terms of the adverse media I spoke about. The watch and sanctions list, those are all global. There's a variety of things that can be managed globally. Some of it, in terms of the financial, for instance, it depends on which country we're talking about and how much information can be obtained within that country, and secondarily, whether it can be monitored on an ongoing basis. Again, it depends on which country we're speaking about. In summary Establishing a world-class supplier risk management program involves understanding the evolution of risk management practices, addressing increasing complexities, and incorporating critical components such as financial stability, digital insurance verification, and continuous monitoring. By proactively managing supplier risk, companies can safeguard their supply chain and ensure compliance. Want to go deeper? Watch our on-demand webinar with GRMS If you would like to hear more about GRMS, watch our on-demand webinar Mitigating Supplier Risk in A Changing World." Gerard goes into greater detail on best practices and how you can proactively manage supplier risk management while staying resilient and the new normal.

Sep 28,2020 by Gary Stockton

Small-business credit outlook remains negative in a poor sales environment

Experian and Moody's Analytics have just released the Q2 2020 Main Street Report. The report brings deep insight into the overall financial well-being of the small-business landscape, as well as offer commentary on business credit trends, and what they mean for lenders and small-businesses.  Small businesses have turned to borrowing to survive periods of prolonged slumping sales, in many cases from government programs offering loan forgiveness. This increased borrowing has masked rising delinquent balances, but such a solution is a short-term fix. To keep their credit current, small businesses will need to find ways to generate revenue. Defaults are expected to rise in coming quarters as forbearance programs expire and as customers are likely to change their priorities in the wake of COVID-19. In Q2, moderate delinquency, defined as 31-90 days past due, rose to 1.66 percent from 1.61 percent, marking the fourth consecutive quarter of increasing delinquency, and the first year-over-year increase since this time last year. The closure of many state and local economies in April and the first half of May left many businesses facing severe revenue shortfalls in the second quarter. This environment has resulted in businesses listing poor sales as the second most important problem facing small businesses, according to the NFIB. If you would like to get the full analysis of the data behind the latest Main Street Report, presented by leading economists from Moody's Analytics and Experian, watch the Quarterly Business Credit Review webinar.

Aug 21,2020 by

Maximizing receivables as delinquencies rise – Sip and Solve

As business delinquencies rise in response to COVID-19, credit departments are becoming increasingly challenged.  In our August 13th Sip and Solve webinar, John Krickus and Andrew Moore will be on hand to share some strategies for maximizing receivables amid rising delinquencies. Managing receivables has never been more important or more challenging. Traditional approaches may no longer apply. In this 15-minute Sip and Solve session, we discuss some solutions for effectively and efficiently handling the increase in receivables many companies are facing. After watching this talk you will learn three key takeaways: Prioritizing receivable management in today's environment Analytic tools for managing receivables Flexing receivables strategies to meet your company's priorities Click to view full slides and transcripts from this session.

Jul 28,2020 by

4 Ideas to Help Your Company Weather the Covid-19 Downturn

In a favorable economic climate, business resilience is often treated as an afterthought. Success is measured in rapid growth and leaps of progress, while failure is little more than a tempering of that expansion.

Jul 20,2020 by Gary Stockton

Anatomy of a Redesign – BusinessIQ 2.0

This year, Experian business information services released some major enhancements to our BusinessIQ product. The project was completed by a highly skilled team here at Experian and heavily driven by customer feedback. Today we'll speak with Casey Hald. one of our lead software developers as he takes us through some of the enhancements to BusinessIQ.

Jul 14,2020 by

Beyond Credit Risk – Understanding Alternative Data

When insurance underwriters make mistakes, bad policies can cost billions. Alternative forms of data is helping change those outcomes, particularly for insurance providers in helping them identify blind spots and accurately underwrite policies. Watch our special Insurance-focused webinar titled "Beyond Credit Risk – Understanding Alternative Data" with HazardHub. Heath Foley and Carl Stronach from Experian is joined by Bob Frady from HazardHub during this lively discussion. Alternative sources of data are growing in importance in the market. The key to our data platform is constantly investing and sourcing a wider variety of data such as geographic hazards, social media, and OSHA data in order to represent a fuller picture of the health of the business.  In this one hour talk, we walk through: Utilizing property-level hazard risk assessments The growing importance of alternative sources of data How to bring superior data to power comprehensive insights Related information What is alternative and non-traditional data/

Jun 11,2020 by Gary Stockton

Practical AI: Predicting Business Outcomes with Analytics

Matt Shubert, Experian's Director of Data Science and Modeling participated in a discussion about trends in AI and Machine Learning. He shared insights on how Experian Business Information Services is leveraging these technologies for clients. Matt and a panel of industry experts discuss how businesses are taking advantage of predictive analytics technology to gain a competitive edge in the marketplace. Webinar Highlights: – Use cases that show how AI and machine learning are helping companies be more proactive than ever – How predictive modeling can lead to more informed business decisions – What steps organizations can take to adopt an AI-enhanced analytics strategy that works for them – And more! Panelists: Puravee Bhattacharya, Senior Data Scientist and Analytics, BI & Performance Reporting at Energia Nirupam Srivastava, Vice President – Strategy and AI at Hero Enterprise Matt Shubert, Director of Data Science and Modeling at Experian

Jun 08,2020 by

Mitigating fraud during a crisis – Sip and Solve

In 2019, 3 in 5 businesses noticed an increase in fraud over a 12-month period. Today, in the face of COVID-19 and the economic downturn, it’s safe to assume that these numbers have increased.

Jun 01,2020 by

Small-business credit outlook turns negative in the wake of COVID-19

Experian and Moody's Analytics have just released the Q1 2020 Main Street Report. The report brings deep insight into the overall financial well-being of the small-business landscape, as well as offer commentary on business credit trends, and what they mean for lenders and small-businesses. After just one quarter, there’s no doubt the theme of 2020 is the pandemic, Covid-19. Unrelated to the pandemic, and subsequent shuttering of a swath of economies across the world, delinquencies rose in the first quarter. This was occurring as businesses reduced their borrowing. Lower borrowing will not have lasted long though, as government efforts to aid small business have taken the form of SBA lending. In Q1, the slowing of businesses pursuing credit pushed moderately delinquent balances up to 1.61 percent from 1.60 percent in the fourth quarter of 2019. # DPD Q1 19 Q4 19 Q1 20 Moderately delinquent 31–90 1.74% 1.60% 1.61% Severely delinquent 91+ 3.35% 2.29% 2.68% Bankruptcy 0.16% 0.16% 0.16% The bankruptcy rate was essentially flat in the first quarter, rising to 16.3 basis points from 16.1 in Q4. But the rate increased as fewer firms were reported as having active credit balances. The Federal Reserve’s Senior Loan Officer Survey indicates lenders are seeing higher demand than usual for Commercial & Industrial loans. This indicates the beginning of increasing loan demand this year, as small firms look to borrow to ride out lower consumer demand and remain in business. Watch the Quarterly Business Credit Review Get the full analysis of the data behind the Main Street Report by watching the experts from Experian and Moody’s in the Quarterly Business Credit Review.

May 18,2020 by

Commercial Insights Hub

Follow Us!

Subscribe to our blog

Enter your name and email for the latest updates.

This site is protected by reCAPTCHA and the Google Privacy Policy and Terms of Service apply.

About this blog

The latest insight, tips, and trends on all things related to commercial risk by the team at Experian Business Information Services. Please follow us on social media.

Stay informed by subscribing to this blog

Sign up for email notifications when new content has been published by Experian Business Information Services.
Sign Up