


Business Information Blog
Credit Management

Reports & Scores

Data & Analytics

The latest from our experts

How Social Media Insight helps to mitigate risk while creating opportunities for small business
Data and AnalyticsAlternative data such as social media data can be used to lift the business credit scores of thin-file businesses. We explain how.

To make the most accurate business credit decisions possible, many companies are turning to data-driven decisioning models powered by artificial intelligence (AI) within machine learning engines.

Improving Customer Experience for Utility Companies Through Decisioning as a Service (DaaS)
Telecommunications, Cable and UtilitiesFor utility companies, the customer onboarding process can sometimes be complex, especially if a manual credit decisioning process is in play. We explore ways to improve that process with DaaS.
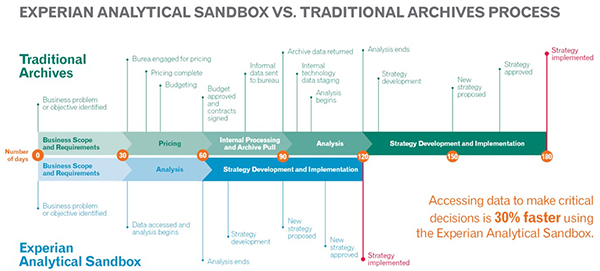
The appetite for businesses incorporating big data is growing significantly as the data universe continues to expand at an astronomical rate. In fact, according to a recent Accenture study, 79% of enterprise executives agree that companies that do not embrace big data will lose their competitive position and could face extinction.
A gastropub restaurant applies for business insurance and is approved. However, social media insights show the restaurant is declining. Even though underwriters usually take a quick look at social media postings, evaluating the trends of the business is not part of the decision process.

Integrating credit decisions means moving toward an automated solution that integrates credit decisions with ERP, CRM, or other custom system, employing APIs.

Helping credit management professionals with 4 common mistakes credit and risk managers need to avoid to successfully manage their portfolio.
Experian Product Manager, Erikk Kropp, discusses best practices for automating credit decisioning for a faster approval process.

Experian has introduced Social Media Insight, breakthrough social media data for managing risk. Use social media data to mitigate risk.
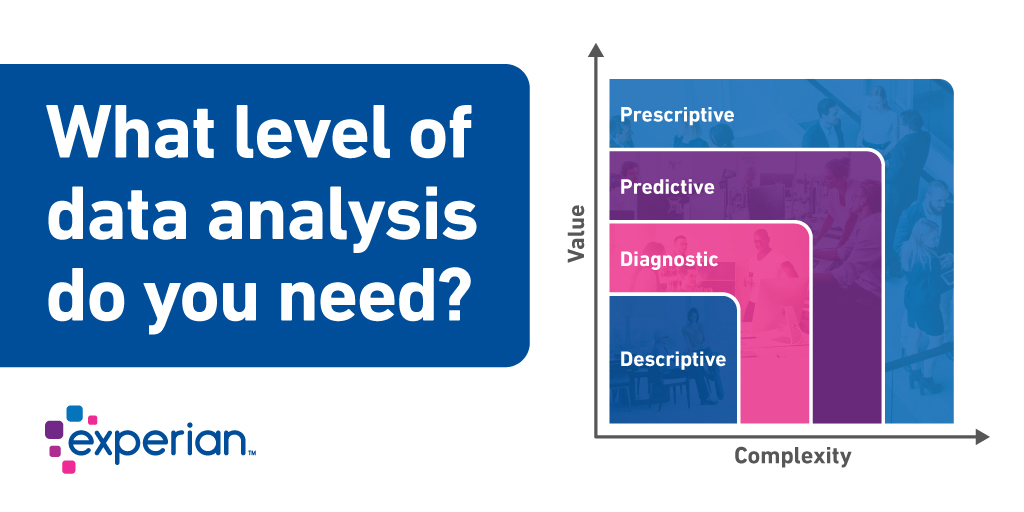
Data analysis surrounding lending practices for commercial lenders falls into 4 distinct buckets that define scope, usability, and purpose. In this post we will discuss how they differ in terms of value and complexity.

All business customers are not created equal. Successful credit management requires you to carefully evaluate the financial health of every business
You likely go to great lengths to protect your own identity from fraud and theft. But are you actively protecting your business’s identity as well?