Loading...

With Consumers Focusing on Used Vehicles in Q2 2022, Credit Unions Grab Market Share

Published: August 25, 2022 by Melinda Zabritski

Q4SAFM930x420

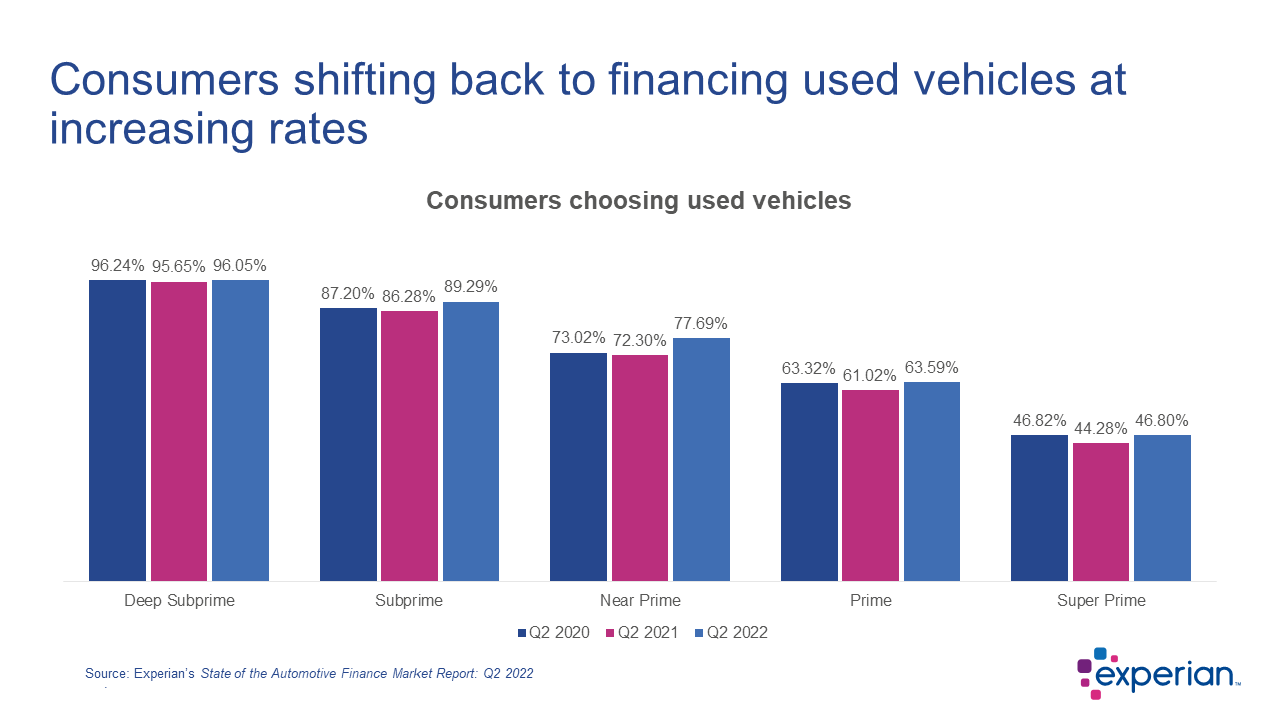
Consumers are shifting to used vehicles over new, with a higher percentage of consumers financing used. The move comes as the industry continues to grapple with inventory shortages, driving vehicle values higher.

The trend was seen across all credit score bands, with prime consumers choosing used vehicles 63.59% percent of the time in Q2 2022, up from 61.02% in Q2 2021, and subprime consumers opting for used vehicles 89.29% of the time up from 86.28%, in the same time frame.

The shift back to used vehicles comes as consumers are having to pay significantly more, as inventory shortages keep pushing vehicle values higher. However, this also means consumers are getting more for their trade-ins, which can help offset the cost of their next vehicle.

Used Financing Q2 2022

In Q2 2022, the average new vehicle loan amount was $40,290, an increase from $35,587 during the same time frame last year. The average used vehicle loan amount saw an even more significant increase, reaching $28,534 in Q2 2022, up from $24,047 in Q2 2021. These increases naturally led to higher average monthly payments. The average new vehicle monthly payment increased $85 year-over-year to reach $667, while the average used vehicle monthly payment increased $75 year-over-year, clocking in at $515.

Credit unions reach highest total market share in five years

With the increase in used vehicle loans, credit unions grew market share in both new and used vehicle financing. In fact, in Q2 2022, credit unions reached their highest total market share in the last five years, at 25.81%.

Breaking down the data further, credit unions grew from 11.15% in Q2 2021 to 21.35% in Q2 2022 across all new financing. Credit unions came in third to banks and captives, though there were notable decreases in market share for both those lenders. Captives decreased from 56.2% in Q2 2021 to 46.14% in Q2 2022, while banks went from 27.25% to 25.94% in the same time frame.

On the used side of financing, credit unions saw even more significant gains, with used vehicle finance market share reaching 28.62% in the second quarter of 2022 up from 23.49% in Q2 2021. This brings credit unions to just below banks, which held 29.19% in Q2 2022, a drop from 32.5% in Q2 2021. The only other lenders to gain market share this quarter were finance companies, which grew from 16.44% to 17.18% year-over-year.

Understand trends such as these can help lenders and dealers be equipped to make the most strategic decisions as they continue to navigate the uncertain market.

To learn more about lender market share and other automotive finance trends, watch the entire State of the Automotive Finance Market: Q2 2022 presentation on demand.

Related Posts

With the National Automobile Dealers Association (NADA) Show set to kickoff later this week, it seemed fitting to explore how the shifting dynamics of the used vehicle market might impact dealers and buyers over the coming year. Shedding light on some of the registration and finance trends, as well as purchasing behaviors, can help dealers and manufacturers stay ahead of the curve. And just like that, the Special Report: Automotive Consumer Trends Report was born. As I was sifting through the data, one of the trends that stood out to me was the neck-and-neck race between Millennials and Gen X for supremacy in the used vehicle market. Five years ago, in 2019, Millennials were responsible for 33.3% of used retail registrations, followed by Gen X (29.5%) and Baby Boomers (26.8%). Since then, Baby Boomers have gradually fallen off, and Gen X continues to close the already minuscule gap. Through October 2024, Millennials accounted for 31.6%, while Gen X accounted for 30.4%. But trends can turn on a dime if the last year offers any indication. Over the last rolling 12 months (October 2023-October 2024), Gen X (31.4%) accounted for the majority of used vehicle registrations compared to Millennials (30.9%). Of course, the data is still close, and what 2025 holds is anyone’s guess, but understanding even the smallest changes in market share and consumer purchasing behaviors can help dealers and manufacturers adapt and navigate the road ahead. Although there are similarities between Millennials and Gen X, there are drastic differences, including motivations and preferences. Dealers and manufacturers should engage them on a generational level. What are they buying? Some of the data might not come as a surprise but it’s a good reminder that consumers are in different phases of life, meaning priorities change. Over the last rolling 12 months, Millennials over-indexed on used vans, accounting for more than one-third of registrations. Meanwhile, Gen X over-indexed on used trucks, making up nearly one-third of registrations, and Gen Z over-indexed on cars (accounting for 17.1% of used car registrations compared to 14.6% of overall used vehicle registrations). This isn’t surprising. Many Millennials have young families and may need extra space and functionality, while Gen Xers might prefer the versatility of the pickup truck—the ability to use it for work and personal use. On the other hand, Gen Zers are still early in their careers and gravitate towards the affordability and efficiency of smaller cars. Interestingly, although used electric vehicles only make up a small portion of used retail registrations (less than 1%), Millennials made up nearly 40% over the last rolling 12 months, followed by Gen X (32.2%) and Baby Boomers (15.8%). The market at a bird’s eye view Pulling back a bit on the used vehicle landscape, over the last rolling 12 months, CUVs/SUVs (38.9%) and cars (36.6%) accounted for the majority of used retail registrations. And nearly nine-in-ten used registrations were non-luxury vehicles. What’s more, ICE vehicles made up 88.5% of used retail registrations over the same period, while alternative-fuel vehicles (not including BEVs) made up 10.7% and electric vehicles made up 0.8%. At the finance level, we’re seeing the market shift ever so slightly. Since the beginning of the pandemic, one of the constant narratives in the industry has been the rising cost of owning a vehicle, both new and used. And while the average loan amount for a used non-luxury vehicle has gone up over the past five years, we’re seeing a gradual decline since 2022. In 2019, the average loan amount was $22,636 and spiked $29,983 in 2022. In 2024, the average loan amount reached $28,895. Much of the decline in average loan amounts can be attributed to the resurgence of new vehicle inventory, which has resulted in lower used values. With new leasing climbing over the past several quarters, we may see more late-model used inventory hit the market in the next few years, which will most certainly impact used financing. The used market moving forward Relying on historical data and trends can help dealers and manufacturers prepare and navigate the road ahead. Used vehicles will always fit the need for shoppers looking for their next vehicle; understanding some market trends will help ensure dealers and manufacturers can be at the forefront of helping those shoppers. For more information on the Special Report: Automotive Consumer Trends Report, visit Experian booth #627 at the NADA Show in New Orleans, January 23-26.

Published: January 21, 2025 by Kirsten Von Busch

The automotive industry is constantly changing. Shifting consumer demands and preferences, as well as dynamic economic factors, make the need for data-driven insights more important than ever. As we head into the National Automobile Dealers Association (NADA) Show this week, we wanted to explore some of the trends in the used vehicle market in our Special Report: State of the Automotive Finance Market Report. Packed with valuable insights and the latest trends, we’ll take a deep dive into the multi-faceted used vehicle market and better understand how consumers are financing used vehicles. 9+ model years grow Although late-model vehicles tend to represent much of the used vehicle finance market, we were surprised by the gradual growth of 9+ model year (MY) vehicles. In 2019, 9+MY vehicles accounted for 26.6% of the used vehicle sales. Since then, we’ve seen year-over-year growth, culminating with 9+MY vehicles making up a little more than 30% of used vehicle sales in 2024. Perhaps more interesting though, is who is financing these vehicles. Five years ago, prime and super prime borrowers represented 42.5% of 9+MY vehicles, however, in 2024, those consumers accounted for nearly 54% of 9+MY originations. Among the more popular 9+MY segments, CUVs and SUVs comprised 36.9% of sales in 2024, up from 35.2% in 2023, while cars went from 44.3% to 42.9% year-over-year and pickup trucks decreased from 15.9% to 15.6%. 2024 highlights by used vehicle age group To get a better sense of the overall used market, the segments were broken down into three age groups—9+MY, 4-8MY, and current +3MY—and to no surprise, the finance attributes vary widely. While we’ve seen the return of new vehicle inventory drive used vehicle values lower, it could be a sign that consumers are continuing to seek out affordable options that fit their lifestyle. In fact, the average loan amount for a 9+MY vehicle was $19,376 in 2024, compared to $24,198 for a vehicle between 4-8 years old and $32,381 for +3MY vehicle. Plus, more than 55% of 9+MY vehicles have monthly payments under $400. That’s not an insignificant number for people shopping with the monthly payment in mind. In 2024, the average monthly payment for a used vehicle that falls under current+3MY was $608. Meanwhile, 4-8MY vehicles came in at an average monthly payment of $498, and 9+MY vehicles had a $431 monthly payment. Taking a deeper dive into average loan amounts based on specific vehicle types—as of 2024, current +3MY cars came in at $28,721, followed by CUVs/SUVs ($31,589) and pickup trucks ($40,618). As for 4-8MY vehicles, cars came in with a loan amount of $22,013, CUVs/SUVs were at $23,133, and pickup trucks at $31,114. Used 9+MY cars had a loan amount of $19,506, CUVs/SUVs came in at $17,350, and pickup trucks at $22,369. With interest rates remaining top of mind for most consumers as we’ve seen them increase in recent years, understanding the growth from 2019-2024 can give a holistic picture of how the market has shifted over time. For instance, the average interest rate for a used current+3MY vehicle was 8.0% in 2019 and grew to 10.2% in 2024, the average rate for a 4-8MY vehicle went from 10.3% to 12.9%, and the average rate for a 9+MY vehicle increased from 11.4% to 13.8% in the same time frame. Looking ahead to the used vehicle market It’s important for automotive professionals to understand and leverage the data of the used market as it can provide valuable insights into trending consumer behavior and pricing patterns. While we don’t exactly know where the market will stand in a few years—adapting strategies based on historical data and anticipating shifts can help professionals better prepare for both challenges and opportunities in the future. As used vehicles remain a staple piece of the automotive industry, making informed decisions and optimizing inventory management will ensure agility as the market continues to shift. For more information, visit us at the Experian booth (#627) during the NADA Show in New Orleans from January 23-26.

Published: January 21, 2025 by Melinda Zabritski

Electric vehicles (EVs) are the topic of conversation in the automotive industry, but we’re continuing to see another fuel type pick up speed. With consumer demand shifting and drivers exploring more fuel-efficient options, the automotive market is leaning back into hybrids. In fact, new retail hybrid registrations grew to 11.5% through Q3 2024, from 9.5% through Q3 2023, according to Experian’s Automotive Market Trends Report: Q3 2024. Meanwhile, EVs increased from 7.7% to 8.2% year-over-year and gasoline vehicles declined to 70.4% this year, from 72.7% last year. Despite EVs gaining notable attention over recent years, some consumers may be factoring in the benefits of opting for a hybrid, such as the convenience of driving a longer distance without facing challenges as charging stations remain limited. As more manufacturers adapt to consumer needs and roll out additional vehicles, data shows 9.1% of 2024 model year vehicles in operation were attributed to hybrids, while 6.2% of 2024 model years were EVs through Q3 2024. Having more models enter the market has shifted the hybrid and plug-in hybrid electric vehicle (PHEV) market share, with the Toyota Camry making up 12.5% of the market share this quarter, a notable increase from 2.4% last year. On the other hand, the Jeep Wrangler 4xe went from having 4.5% of market share last year to 2.4% through Q3 2024. With many consumers continuing to have some concerns around EVs such as range anxiety and charging times, they’re seeking a more practical solution for their daily driving needs. The balance of fuel options provides more convenience—making hybrids an appealing choice for those wanting an EV alternative. It’s important for manufacturers to stay ahead of the competitive market as it’s constantly evolving. Leveraging the most current data can provide solutions that address both feasibility and consumer preference. To learn more about vehicle market trends, view the full Automotive Market Trends Report: Q3 2024 presentation on demand.

Published: January 10, 2025 by John Howard