Customer Targeting & Segmentation

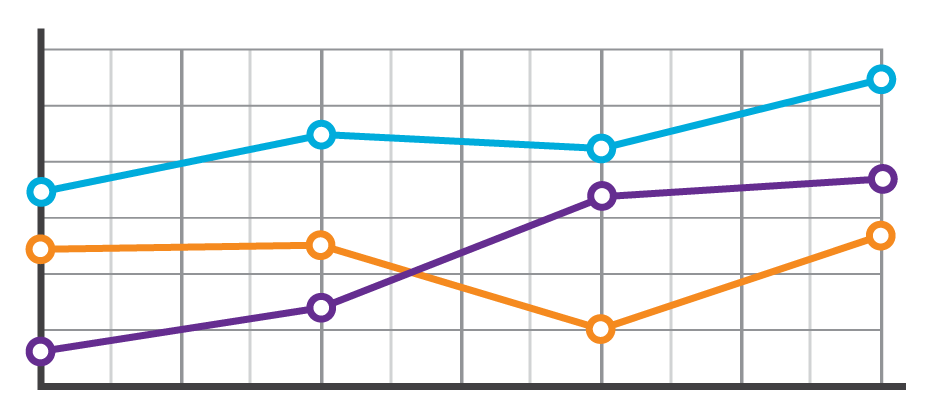
You just finished redeveloping an existing scorecard, and now it’s time to replace the old with the new. If not properly planned, switching from one scorecard to another within a decisioning or scoring system can be disruptive. Once a scorecard has been redeveloped, it’s important to measure the impact of changes within the strategy as a result of replacing the old model with the new one. Evaluating such changes and modifying the strategy where needed will not only optimize strategy performance, but also maximize the full value of the newly redeveloped model. Such an impact assessment can be completed with a swap set analysis. The phrase swap set refers to “swapping out” a set of customer accounts — generally bad accounts — and replacing them with, or “swapping in,” a set of good customer accounts. Swap-ins are the customer population segment you didn’t previously approve under the old model but would approve with the new model. Swap-outs are the customer population segment you previously approved with the old model but wouldn’t approve with the new model. A worthy objective is to replace bad accounts with good accounts, thereby reducing the overall bad rate. However, different approaches can be used when evaluating swap sets to optimize your strategy and keep: The same overall bad rate while increasing the approval rate. The same approval rate while lowering the bad rate. The same approval and bad rate but increase the customer activation or customer response rates. It’s also important to assess the population that doesn’t change — the population that would be approved or declined using either the old or new model. The following chart highlights the three customer segments within a swap set analysis. With the incumbent model, the bad rate is 8.3%. With the new model, however, the bad rate is 4.9%. This is a reduction in the bad rate of 3.4 percentage points or a 41% improvement in the bad rate. This type of planning also is beneficial when replacing a generic model with another or a custom-developed model. Click here to learn more about how the Experian Decision Analytics team can help you manage the impacts of migrating from a legacy model to a newly developed model.

The credit card marketplace is a crowded and complex landscape. Recent research by Experian shows the average U.S. consumer has 3.1 credit cards and 2.5 retail cards, with an average balance of $6,354 and $1,841, respectively. So how can you build upon your existing customer relationships and offer the right products to the right people at the right time? By understanding consumer behavior. Pretty simple concept. But targeting viable consumers and making enticing offers takes some detective work. Gone are the days of demographic-based approach to audience segmentation for credit marketing campaigns. Consumers are now engaged on their smartphones, laptops, tablets, fitness bands, across countless apps, browsers, emails and more. Simply knowing a person’s gender and age doesn’t provide any information about how he spends the day, his consumer behaviors, personal interests, unique wants or needs. Developing rich consumer personas based on transaction credit data can be a powerful tool to understanding consumers so lenders can design more relevant and personalized credit offers, experiences and products to a very targeted audience. Experian DataLabs can help by analyzing transaction data to understand the consumers in your portfolio. For example, looking at your portfolio of 40-year-olds in the U.S. provides basic demographic information. A closer look at transaction data could reveal unique details within the age group to help you group and target, such as: Frequent travelers: These road warriors log serious miles. If they’re not traveling for work, they’re cashing in miles for vacation. This unique group leads your portfolio in airfare, cruise line, car rental, hotel and travel agency spend. With so much time spent away from home, this group is rarely found in grocery stores. Local business owners: Advertising, computer equipment, and software are typical expenses of this segmented group. There may be an opportunity to capture spend outside their business activity or to ensure they have the right card to fit their business needs. Constant commuters: These consumers use their card for local travel and transportation. And they are less likely to use their card for expenses related to other types of travel or maintaining a vehicle. After a long day, they like to grab a drink while waiting for the train. Online Shoppers: Consumers in this group use their card with various online merchants, including Amazon, Etsy, iTunes, and PayPal. Online shoppers are also above average spenders in elementary education, child care services, and family clothing. Social hipsters: They can be found meeting with friends for coffee and drinks, and are more likely to rely on local transportation and tend to eat out instead of cooking in. Effective audience segmentation ensures that your marketing dollars are invested in real people who are most likely to respond on certain media, have already expressed an interest in your product, and are geographically accessible to a specific retail location. Every campaign should be as dynamic and unique as its consumers. The powerful combination of consumer and transaction data allows you to customize audience segments to maximize customer engagement and drive campaign success.

As we enter the holiday season, headlines abound around the shifts and trends in retail. How are consumers shopping? What are they buying online versus in-store? How can retailers maintain share and thrive? To gain some fresh perspective on the retail space, we interviewed John Squire, CEO and co-founder of DynamicAction, a business featuring advanced analytics solutions designed specifically for eCommerce, store and omnichannel retail teams. Squire has had a tenured career in the retail and technology sectors serving in key executive roles for IBM Smarter Commerce and Coremetrics. He has spent the past decade guiding nearly every retail brand to a better understanding of their customers and utilization of their data to make profitable decisions. Business headlines claim we are in the midst of a retail apocalypse. Is this statement a reality? The reality is that retail is in a renaissance – a revolution driven by the most empowered, connected consumer in history, a burgeoning technology infrastructure and retail tech innovators who have disrupted the status quo. The most agile of retailers and brands are leaning forward to serve their customer with remarkable experiences in the store, online and anywhere the customer decides to interact with the brand. And for those retailers, the days ahead are filled with newfound opportunity. However, the retailers and brands who don’t have a strong core purpose beyond being filler between anchor stores may no longer have a place in this new world of retail. The strongest retailers and brands will tap into their wealth of customer data to better understand, and therefore better serve their customers, creating long-term relationships. They should only continue gain in strength as consumers concentrate more and more of their time (and wallets) with businesses that passionately focus on their unique needs and buying patterns. It seems like shoppers are increasingly turning online to make their purchases. Is this the case, and do we see seasonal spikes with this trend? The key for successful retailers is to understand that customers aren’t just searching, browsing, buying and returning online OR in-store. They are shopping online AND in-store … and even online while in-store. Shoppers simply do not see channels, and the sooner that retailers reorganize their mindset, their organizations and their data understanding around this reality, the more successful they will become. Shoppers are indeed moving online with increasing frequency and larger amounts of their overall spending. Connecting data across the enterprise, across their partners and across social channels is critical in enabling their retailing teams to make decisions on how best to simultaneously serve their customers and their company’s shareholders. If retailers have a store credit card to offer to consumers, how can they encourage use and get them to maximize spend? Are there particular strategies they should employ? As with any loyalty program or service item, consumers are looking for tools and offers they value. Therein lies the opportunity and the challenge. Value can come in many forms, depending on the individual. Does the credit card offer travel or retail points, or dollars that they can accumulate? Does the credit card save them time? Provide them with additional purchasing power? Reduce their friction of making large purchases? Increase the security of the initial purchase and long-time use of the product or service? The competition for just a consumer’s current and future wallet is being upended by retailing offers that are serving up entertainment, services, convenience and broader product selections. Understanding the high-value activities correlated to their VIP consumers generating the highest amount of profit for the business is the essential to building strategies for encouraging card use. Beyond online shopping, are there other retail trends you see emerging in the coming year? What excites you about the space? Online shopping is not a trend; it is retail’s greatest disruption of the last 100 years. Digitization of shopping in both the online and store setting is what thrills me. One to watch is Wal-mart. The company is taking a highly energized track to build a business of next-gen brands and using their supply chain acumen to battle Amazon, while simultaneously gaining huge amounts of market share from other less sophisticated and strong retailers. In addition, seeing how next-gen brands like Warby Parker, Everlane, Untuckit, Bonobos, Indochino and Rent the Runway are rapidly building out a store experience, albeit radically different than the stores of the past, is exciting to watch. Seeing the growth in Drone deliveries outside the US for retail and commercial applications is surely the next big jump for ‘Next Hour’ in-home delivery. Made-to-order with a very short lead-time is also a big trend to keep an eye on. However, what excites me most in the industry is the universal mind shift that is becoming undeniable in retail: that data understanding and action will be the very basis for customer centricity and companies’ growth. Retailers have had access to these data pools for ages, but the ability to sync the data sets across channels, make sense of the findings and take action at the speed the consumer expects is truly the next leap forward for great retailers. To learn more about the state of retail credit cards, access our latest report.

If someone asked you for stats on your retail card portfolio, would you respond with the number of accounts? Average spend per month? Or maybe you know the average revolving balance and profitability. Notice something about that list? Too many lenders think of their portfolio and customers as numbers when in reality these are individuals expressing themselves through their transactions. In an age where consumers increasingly expect customized experiences, marketing to account #5496115149251 is likely to fall on deaf ears. Credit card transaction data including bankcard, retail, and debit cards holds a wealth of information about your consumers' tastes and preferences. Think about all the purchases you made using a credit card this past month. Did you shop at high-end retail stores or discount stores? Expensive restaurants or fast food? Did you buy new clothes for your kids? Maybe you went to the movies, or met friends at a bar. How you use your card paints a picture of who you are. The trick is turning all those numbers into insights. You may have been swept up in all the excitement around Apple’s announcement of the iPhone X in August. However, you may have overlooked the incorporation of Neural Embedding, or machine learning, as one of the most powerful features of the new phone. Experian DataLabs has developed an innovative approach to analyzing transaction data using similar techniques. Unstructured machine learning is applied and patterns begin to emerge around customer spending. The patterns are highly intuitive and give personality to what was previously an indecipherable stream of data. For example, one group may be more likely to spend on children’s clothing, child care services, and theme parks while another spends on expensive restaurants, airlines, and golf courses. If these two consumers happened to spend approximately the same each month on your card, you’d probably treat them as category. But understanding one is a young family and their other is jet setter allows you to tailor messaging, offers, and terms to their needs and use of your products. Further, you can ensure they have the best product based on their lifestyle to minimize silent attrition as their needs evolve. But it’s not just about marketing. When your latest attrition dashboard is updated, what period are you measuring? Do you analyze account closures from the previous month? Maybe a few months back? Understanding churn is important, but it’s inherently reactive and backward looking. You wouldn’t drive a car looking in the rearview mirror, would you? Experian enables clients to actively monitor the portfolio for attrition risk by analyzing usage patterns and predicting future spend. Transactions are then monitored up to daily and, when spend doesn’t occur as expected, an alert is sent so you can proactively attempt to save the account before it closes. These algorithms are finely tuned to reduce false positives that can come from seasonality or predictable gaps in spend such as only using a card at certain times during the week. Most importantly, it gives you an opportunity to manage each account and address changing customer needs instead of waiting for customers to call to cancel. So how well do you know your customers? If you’re still looking at them as numbers, it may be time to explore new capabilities that allow you to act small, no matter how large your portfolio. Transaction Data Insights brings cutting-edge machine learning capabilities to lenders of all sizes. By digging into behavioral segments and having tools to monitor and send alerts when a consumer is showing signs of attrition risk, card portfolios can suddenly treat customers like people, providing the customized experience they increasingly expect.

Our national survey found that consumers struggle to find a credit card that meets their needs. They say there are too many options and it’s too time-consuming to research. What do consumers want? With 53% of survey respondents not satisfied with their current cards and 1 in 3 saying they’re likely to get a new card within 6 months, now’s the time to start personalizing offers and growing your portfolio. Start personalizing offers today>

Everyone loves a story. Correction, everyone loves a GOOD story. A customer journey map is a fantastic tool to help you understand your customer’s story from their perspective. Perspective being the operative word. This is not your perspective on what YOU think your customer wants. This is your CUSTOMER’S perspective based on actual customer feedback – and you need to understand where they are from those initial prospecting and acquisition phases all the way through collections (if needed). Communication channels have expanded from letters and phone calls to landlines, SMS, chat, chat bots, voicemail drops, email, social media and virtual negotiation. When you create a customer journey map, you will understand what channel makes sense for your customer, what messages will resonate, and when your customer expects to hear from you. While it may sound daunting, journey mapping is not a complicated process. The first step is to simply look at each opportunity where the customer interacts with your organization. A best practice is to include every department that interacts with the customer in some way, shape or form. When looking at those touchpoints, it is important to drill down into behavior history (why is the customer interacting), sociodemographic data (what do you know about this customer), and customer contact patterns (Is the customer calling in? Emailing? Tweeting?). Then, look at your customer’s experience with each interaction. Again, from the customer’s viewpoint: Was it easy to get in touch with you? Was the issue resolved or must the customer call back? Was the customer able to direct the communication channel or did you impose the method? Did you offer self-serve options to the right population? Did you deliver an email to someone who wanted an email? Do you know who prefers to self-serve and who prefers conversation with an agent, not an IVR? Once these two points are defined: when the customer interacts and the customer experience with each interaction, the next step is simply refining your process. Once you have established your baseline (right channel, right message, right time for each customer), you need to continually reassess your decisions. Having a system in place that allows you to track and measure the success of your communication campaigns and refine the method based on real-time feedback is essential. A system that imports attribute – both risk and demographic – and tracks communication preferences and campaign success will make for a seamless deployment of an omnichannel strategy. Once deployed, your customer’s experience with your company will be transformed and they will move from a satisfied customer to one that is a fan and an advocate of your brand.

With 1 in 6 U.S. residents being Hispanic, now is a great time for financial institutions to reflect on their largest growth opportunity. Here are 3 misconceptions about the multifaceted Hispanic community that are prevalent in financial institutions: Myth 1: Hispanic consumers are only interested in transaction-based products. In truth, product penetration increases faster among Hispanic members compared with non-Hispanic members when there’s a strategic plan in place. Myth 2: Most Hispanics are undocumented. The facts show that of the country’s more than 52 million Hispanics, most are native-born Americans and nearly 3 in 4 are U.S. citizens. Myth 3: The law prevents us from serving immigrants. Actually, financial institutions can compliantly lend to individuals who have an Individual Taxpayer Identification Number. There are many forms of acceptable government-issued identification, such as passports and consular identification cards. Solidifying the right organizational mentality, developing a comprehensive strategy based on segmentation, and defining what success truly looks like. These are all part of laying the foundation for success with the Hispanic market. Learn more>

Direct mail is dead. It’s so 90s. Digital is the way to reach consumers. Marketers have heard this time and again, and many have shifted their campaign focus to the digital space. But as our lives become more and more consumed by digital media, consumers are giving less time and attention to the digital messages they receive. The average lifespan of an email is now just two seconds and brand recall directly after seeing a digital ad is just 44%, compared to direct mail which has a brand recall of 75%. Further research shows direct mail marketing is one of the most effective tools for customer acquisition and loan growth. The current Data & Marketing Association (DMA) response rate report reveals the direct mail response rates for 2016 were at the highest levels since 2003. Additionally, while mailing volume has trended down since October 2016, response rates have trended up, and reached 0.68% in March 2017, up from 0.56% in October 2016. Using data and insights to tailor a direct mail campaign can yield big results. Here are some attention-grabbing tips: Identify Your Target Market: Before developing your offer and messaging strategy, begin with the customer profile you are trying to attract. Propensity models and estimated interest rates are great tools for identifying consumers who are more likely to respond to an offer. Adding them as an additional filter to a credit-qualified population can help increase response rates. Verify your Mailing List: Experian’s address verification software validates the accuracy and completeness of a physical address, flags inaccuracies, and corrects errors before they can negatively impact your campaign. Personalize the Offer: Consumers are more likely to open offers that are personalized, and appeal to their life stage, organizational affiliations or interests. Experian’s Mosiac profile report is a simple, inexpensive way to gather data-based insight into the lifestyle and demographics of your audience. Time the Offer: Timing your campaign with peak market demand is key. For example, personal loan demand is highest in the first quarter after the holidays, while student loans demand peaks in the Spring. Direct mail can help overcome digital fatigue that many consumers are experiencing, and when done right, it’s the printed piece that helps marketers boost response rates.

Many institutions take a “leap of faith” when it comes to developing prospecting strategies as it pertains to credit marketing. But effective strategies are developed from deep, analytical analysis with clearly identified objectives. They are constantly evolving – no setting and forgetting. So what are the basics to optimizing your prospecting efforts? Establish goals Unfortunately, far too many discussions begin with establishing targeting criteria before program goals are set. But this leads to confusion. Developing targeting criteria is kind of like squeezing a balloon; when you restrict one end, the other tends to expand. Imagine the effect of maximizing response rates when soliciting new loans. If no other criteria are considered, you could end up targeting high-risk individuals who cannot get approved elsewhere. Obviously, we’re not interested in increasing originations at all cost; risk must be understood as well. But this is where things get complicated. Lower-risk consumers tend to be the most coveted, get the best offers, and therefore have lower response rates and margins. Simplicity is best The US Navy developed the KISS acronym (keep it simple, stupid) in the 1960s on the philosophy that complexity increases the probability of error. This is largely true in targeting methodologies, but don’t mistake limiting complexity for simplicity. Perhaps the most simplistic approach to prescreen credit marketing is using only risk criteria to set an eligible population. Breaking a problem down to this single dimension generally results in low response rates and wasted budget. Propensity models and estimated interest rates are great tools for identifying consumers that are more likely to respond. Adding them as an additional filter to a credit-qualified population can help increase response rates. But what about ability to pay? So far we’ve considered propensity to open and risk (the latter being based on current financial obligations). Imagine a consumer with on-time payment behavior and a solid credit score who takes a loan only to be unable to meet their obligations. You certainly don’t want to extend debt that will cause a consumer to be overextended. Instead of going through costly income verification, income estimation models can assist with identifying the ability to repay the loan you are marketing. Simplicity is great, but not to the point of being one-dimensional. Take off the blindfold Even in the days of smartphones and GPS navigation, most people develop a plan before setting off on a road trip. In the case of credit marketing, this means running an account review or archive analysis. Remember that last prescreen campaign you ran? What could have happened with a more sophisticated targeting strategy? Having archive data appended to a past marketing campaign allows for “what if” retrospective analysis. What could response rates have been with a propensity tool? Could declines due to insufficient income have been reduced with estimated income? Archive data gives 20/20 hindsight to what could have been. Just like consulting a map to determine the shortest distance to a destination or the most scenic route, retrospective analysis on past campaigns allows for proactive planning for future efforts. Practice makes perfect Even with a plan, you probably still want to have the GPS running. Traffic could block your planned route or an unforeseen detour could divert you to a new path. Targeting strategies must continually be refined and monitored for changes in customer behavior. Test and control groups are essential to continued improvement of your targeting strategies. Every campaign should be analyzed against the goals and KPIs established at the start of the process. New hypotheses can be evaluated through test populations or small groups designed to identify new opportunities. Let’s say you typically target consumers in a risk range of 650-720, but an analyst spots an opportunity where consumers with a range of 625-649 with no delinquencies in the past 12 months performs nearly at the rate of the current population. A small test group could be included in the next campaign and studied to see if it should be expanded in future campaigns. Never “place bets” Assumptions are only valid when they are put to the test. Never dive into a strategy without testing your hypothesis. The final step in implementing a targeting strategy should be the easiest. If goals are clearly understood and prioritized, past campaigns are analyzed, and hypotheses are laid out with test and control groups, the targeting criteria should be obvious to everyone. Unfortunately, the conversation usually starts at this phase, which is akin to placing bets at the track. Ever notice that score breaks are discussed in round numbers? Consider the example of the 650-720 range. Why 650 and not 649 or 651? Without a test and learn methodology, targeting criteria ends up based on conventional wisdom – or worse, a guess. As you approach strategic planning season, make sure you run down these steps (in this order) to ensure success next year. Establish program goals and KPIs Balance simplicity with effectiveness Have a plan before you start Begin with an archive Learn and optimize In God we trust, all others bring data

Historical data that illustrates lower credit card use and increases in payments is key to finding consumers whose credit trajectory is improving. But positive changes in consumer behavior—especially if it happens slowly over time—don’t necessarily impact a consumer’s credit score. And many lenders are missing out on capturing new business by failing to take a closer look. It’s easy to categorize consumers by their credit score alone, but you owe it to your bottom line to investigate further: Are the consumer’s overall payments increasing? Is his credit card utilization decreasing? Are the overall card balances remaining consistent or declining? Could the consumer be within your credit score guidelines within a month or two? And most importantly, could a competitor acquire the consumer a month or two after you declined him? Identifying new customers who previously used credit responsibly is relatively easy since they typically have rich credit profiles that may include a mortgage and numerous types of credit accounts. But how do you evaluate consumers who may look identical? Trended data and attributes provide insight into whether a consumer is headed in the right direction: With more than 613 trended attributes available for real-time decisioning and for batch campaigns, Experian trends key factors that provide the insight needed for lenders to lend deeper without sacrificing credit quality. Looking at trended data and attributes is critical for portfolio growth, and credit line increases based on good credit behavior is a must for lenders for two reasons. First, you’ve already spent the money acquiring the consumer and you should not waste the opportunity to maximize returns. Second, competition is fierce; another lender could reward the consumer for great credit behavior they’ve displayed with your company. Be there first, be consistent, or be left behind. Use Experian’s Payment Stress Attributes and Short-term Utilization Attributes in custom scores or swap-set strategies in order to find quality customers who may be worthy of line increases or other attribute credit terms. Look to trended data to swap in consumers who may fall within a few points under your credit score guidelines, and reward your existing customers before another lender does. Near-prime consumers of today are the prime consumers of tomorrow.

There’s a new crew coming of age. Enter Generation Z. Gen Z — those born between the mid-1990s and the early 2000s — makes up one-quarter of the U.S. population. By 2020, they’ll account for 40% of all consumers. The oldest members of this next cohort — 18- to 20-year-olds — are coming of age. Here are some insights on how this initial segment of Gen Z is beginning to use credit. Credit scores averaged 631 in 2016. Debt levels — consisting largely of bankcards and auto and student loans — are low, with an average debt-to-income ratio of just 5.7%. Average income is $33,800. This generation is being raised in an era of instant, always-on access. They expect a quick, seamless and customized mobile experience. You have just 8 seconds to capture their attention. Webinar: A First Look at Gen Z and Credit

Millennials have long been the hot topic over the course of the past few years with researchers, brands and businesses all seeking to understand this large group of people. As they buy homes, start families and try to conquest their hefty student loan burdens, all will be watching. Still, there is a new crew coming of age. Enter Gen Z. It is estimated that they make up ¼ of the U.S. population, and by 2020 they will account for 40% of all consumers. Understanding them will be critical to companies wanting to succeed in the next decade and beyond. The oldest members of this next cohort are between the ages of 18 and 20, and the youngest are still in elementary school. But ultimately, they will be larger than the mystical Millennials, and that means more bodies, more buying power, more to learn. Experian recently took a first look at the oldest members of this generation, seeking to gain insights into how they are beginning to use credit. In regards to credit scores, the eldest Gen Z members sported a VantageScore® credit score of 631 in 2016. By comparison, younger Millennials were at 626 and older Millennials were at 638. Given their young age, Gen Z debt levels are low with an average debt-to-income at just 5.7%. Their tradelines largely consist of bankcards, auto and student loans. Their average income is at $33.8k. Surprisingly, there was a very small group of Gen Z already on file with a mortgage, but this figure was less than .5%. Auto loans were also small, but likely to grow. Of those Gen Z members who have a credit file, an estimated 12% have an auto trade. This is just the beginning, and as they age, their credit files will thicken, and more insights will be gained around how they are managing credit, debt and savings. While they are young today, some studies say they already receive about $17 a week in allowance, equating to about $44 billion annually in purchase power in the U.S. Factor in their influence on parental or household purchases and the number could be closer to $200 billion! For all brands, financial services companies included, it is obvious they will need to engage with this generation in not just a digital manner, but a mobile manner. They are being raised in an era of instant, always-on access. They expect a quick, seamless and customized mobile experience. Retailers have 8 seconds or less — err on the side of less — to capture their attention. In general, marketers and lenders should consider the following suggestions: Message with authenticity Maintain a long-term vision Connect them with something bigger Provide education for financial literacy and of course Keep up with technological advances. Learn more by accessing our recorded webinar, A First Look at Gen Z and Credit.

Call it big data, smart data or evidence-based decision-making. It’s not just the latest fad, it’s the future of how business will be guided and grow. Here are a few telling stats that show data is exploding and a new age is upon us: Data is growing faster than ever before, and we’re on track to create about 1.7 megabytes of new information per person every second by 2020. The social universe—which includes every digitally connected person—doubles in size every two years. By 2020, it will reach 44 zettabytes or 44 trillion gigabytes, according to CIO. In 2015, more than 1 billion people used Facebook and sent an average of 31.25 million messages and viewed 2.77 million videos each minute. More than 100 terabytes of data is uploaded daily to the social channel. By 2020, more than 6.1 billion smartphone users will exist globally. And there will be more than 50 billion smart connected devices in the world, all capable of collecting, analyzing and sharing a wealth of data. More than one-third of all data will pass through or exist in the cloud by 2020. The IDC estimates that by 2020, business transactions on the internet—business-to-business and business-to-consumer—will reach 450 billion per day. All of this new data means we’ll be looking at a whole new set of possibilities and a new level of complexity in the years ahead. The data itself is of great value, however, lenders need the right automated decisioning platform to store, collect, quickly process and analyze the volumes of consumer data to gain accurate consumer stories. While lenders don’t necessarily need to factor in decisioning on social media uploads and video views, there is an expectation for immediacy to know if a consumer is approved, denied or conditioned. Online lenders have figured out how to quickly capture and understand big data, and are expected to account for $122 billion in lending by 2020. This places more pressure on banks and credit unions to enhance their technology to cut down on loan approval times and move away from various manual touch points. Critics of automated decisioning solutions used in lending cite compliance issues, complacency by lenders and lack of human involvement. But a robust platform enables lenders to improve and supplement their current decisioning processes because it is: Agile: Experian hosts our client’s solutions and decisioning strategies, so we are able to make and deploy changes quickly as the needs of the market and business change, and deliver real-time instant decisions while a consumer is at the point of sale. A hosted environment also means reduced implementation timelines, as no software or hardware installation is required, allowing lenders to recognize value faster. A data work horse: Internal and external data can be pulled from multiple sources into a lender’s decisioning model. Lenders may also access an unlimited number of scores and attributes—including real-time access to credit bureau data—and integrate third-party data sources into the decisioning engine. Powerful: A robust decision engine is capable of calculating numerous predictive attributes and custom scoring models, and can also test new strategies against current decision models or perform “what if” simulations on historical data. Data collection, storage and analysis are here to stay. As will be the businesses which are savvy enough to use a solution that can find opportunities and learnings in all of that complex data, quickly curate the best possible actions to take for positive outcomes, and allow lenders and marketers to execute on those recommendations with the click of a button. To learn more about Experian’s decisioning solutions, you can additionally explore our PowerCurve and Attribute Toolbox solutions.
Sometimes life throws you a curve ball. The unexpected medical bill. The catastrophic car repair. The busted home appliance. It happens, and the killer is that consumers don’t always have the savings or resources to cover an additional cost. They must make a choice. Which bills do they pay? Which bills go to the pile? Suddenly, a consumer’s steady payment behavior changes, and in some cases they lose control of their ability to fulfill their obligations altogether. These shifts in payment patterns aren’t always reflected in consumer credit scores. At a single point in time, consumers may look identical. However, when analyzing their past payment behaviors, differences emerge. With these insights, lenders can now determine the appropriate risk or marketing decisions. In the example below, we see that based on the trade-level data, Consumer A and Consumer B have the same credit score and balance. But once we see their payment pattern within their trended data, we can clearly see Consumer A is paying well over the minimum payments due and has a demonstrated ability to pay. A closer look at Consumer B, on the other hand, reveals that the payment amount as compared to the minimum payment amount is decreasing over time. In fact, over the last three months only the minimum payment has been made. So while Consumer B may be well within the portfolio risk tolerance, they are trending down. This could indicate payment stress. With this knowledge, the lender could decide to hold off on offering Consumer B any new products until an improvement is seen in their payment pattern. Alternatively, Consumer A may be ripe for a new product offering. In another example, three consumers may appear identical when looking at their credit score and average monthly balance. But when you look at the trend of their historical bankcard balances as compared to their payments, you start to see very different behaviors. Consumer A is carrying their balances and only making the minimum payments. Consumer B is a hybrid of revolving and transacting, and Consumer C is paying off their balances each month. When we look at the total annual payments and their average percent of balance paid, we can see the biggest differences emerge. Having this deeper level of insight can assist lenders with determining which consumer is the best prospect for particular offerings. Consumer A would likely be most interested in a low- interest rate card, whereas Consumer C may be more interested in a rewards card. The combination of the credit score and trended data provides significant insight into predicting consumer credit behavior, ultimately leading to more profitable lending decisions across the customer lifecycle: Response – match the right offer with the right prospect to maximize response rates and improve campaign performance Risk – understand direction and velocity of payment performance to adequately manage risk exposure Retention – anticipate consumer preferences to build long-term loyalty All financial institutions can benefit from the value of trended data, whether you are a financial institution with significant analytical capabilities looking to develop custom models from the trended data or looking for proven pre-built solutions for immediate implementation.

Reactivation campaigns make economic sense. They build on a brand’s previous investments, targeting customers who already are aware of and previously have engaged with your brand. Use these 4 steps to build a successful reactivation framework: 1. Analyze subscriber data to identify reactivation segments to target. 2. Identify subscriber activity to divide customers into at least 3 unique segments. 3. Develop messaging strategies for each segment. 4. Integrate or suppress inactive subscribers based on whether they re-engage. Reactivation campaigns can deliver significant incremental revenue and position inactive subscribers for further engagement in future campaigns. Download report>