Uncategorized

Once a scorecard has been redeveloped, it is important to measure the impact of changes within the strategy by replacing the old model with the new one. This impact assessment can be completed with a swap set analysis. The term swap set refers to “swapping out” a set of bad accounts and replacing them with or “swapping in” a set of good accounts. Different approaches can be used when evaluating swap sets to optimize your strategy and keep: The same overall bad rate while increasing the approval rate. The same approval rate while lowering the bad rate. The same approval and bad rates but an increase in customer activation or customer response rates. When measuring your swap sets, remember to also include the population that doesn’t change — those accounts that would be approved or declined using either the old or new model. Learn more>

You’ve been tasked with developing a new model or enhancing an existing one, but the available data doesn’t include performance across the entire population of prospective customers. Sound familiar? A standard practice is to infer customer performance by using reject inference, but how can you improve your reject inference design? Reject inference is a technique used to classify the performance outcome of prospective customers within the declined or nonbooked population so this population’s performance reflects its performance had it been booked. A common method is to develop a parceling model using credit bureau attributes pulled at the time of application. This type of data, known as pre-diction data, can be used to predict the outcome of the customer prospect based on a data sample containing observations with known performance. Since the objective of a reject inference model is to classify, not necessarily predict, the outcome of the nonbooked population, data pulled at the end of the performance window can be used to develop the model, provided the accounts being classified are excluded from the attributes used to build the model. This type of data is known as post-diction data. Reject inference parceling models built using post-diction data generally have much higher model performance metrics, such as the KS statistic, also known as the Kolmogorov-Smirnov test, or the Gini coefficient, compared with reject inference parceling models built using pre-diction data. Use of post-diction data within a reject inference model design can boost the reliability of the nonbooked population performance classification. The additional lift in performance of the reject inference model can translate into improvements within the final model design. Post-diction credit bureau data can be easily obtained from Experian along with pre-diction data typically used for predictive model development. The Experian Decision Analytics team can help get you started.

Auto originations continue to increase — particularly within prime categories. According to Experian’s latest State of the Automotive Finance Market report: Prime consumers grabbed the lion’s share of the total finance market, at 40.9%. Super-prime buyers showed the largest increase, reaching 20.2%. Consumers outside the prime category (credit score of 600 or lower) decreased to the lowest share on record since 2012. Credit unions and captive lenders increased market share of total vehicle financing, growing to 21% and 29.8% — an increase of 6.9% and 35.1%, respectively. As auto loan originations continue their upward trend, lenders can stay ahead of the competition by using advanced analytics to target the right customers and increase profitability.

Experian on the State of Identity podcast In today’s environment, any conversation on the identity management industry needs to include some mention of synthetic identity risk. The fact is, it’s top of mind for almost everyone. Institutions are trying to scope their risk level and identify losses, while service providers are innovating ways to solve the problem. Even consumers are starting to understand the term, albeit via a local newscast designed to scare the heck out of them. With all this in mind, I was very happy to be invited to speak with Cameron D’Ambrosi at One World Identity (OWI) on the State of Identity podcast, focusing on synthetic identity fraud. Our discussion focused on some of the unique findings and recommended best practices highlighted in our recently published white paper on the subject, Synthetic identities: getting real with customers. Additionally, we discussed how a lack of agreement on the definition and size of the synthetic identity problem further complicates the issue. This all stems from inconsistent loss reporting, a lack of confirmable victims and an absence of an exact definition of a synthetic identity to begin with. Discussions must continue to better align us all. I certainly appreciate that OWI dedicated the podcast to this subject. And I hope listeners take away a few helpful points that can assist them in their organization’s efforts to better identify synthetic identities, reduce financial losses and minimize reputation risks.

The sheer range of dynamic and emerging fraud tactics can impede agencies from achieving security. These threats must be met with a variety of identity proofing and management tactics. Without monitoring, performance assessments and tuning, a singular and static identity proofing strategy can be exposed by evolving schemes and the use of high-quality compromised identity data. Traditional verification and validation parameters alone are simply too obtuse and can be circumvented easily by those with criminal intent. Static rules based on overly simplistic verification and validation checks can be outsmarted by intelligent fraudsters. Conversely, those same static rules must also have built-in mechanisms to accommodate true-name users who initially may not meet that criteria for identity proofing. Vast and diverse user populations, more arduous — and arguably more difficult to achieve — digital identity guidelines put forth by the National Institute of Standards and Technology, and operational constraints all pose significant challenges for government. But there are ways for government to modernize identity proofing successfully. Modern fraud and identity strategies There are many emerging trends and best practices for modern fraud and identity strategies, including: Applying right-sized fraud and identity proofing solutions. To reduce user friction or service disruption and manage fraud risk appropriately, agencies need to apply fraud mitigation strategies. Such strategies reflect the cost, measured risk and level of confidence, as well as compliance needed, for each interaction. This is called right-sizing the fraud solution. For example, agencies can cater a fraud solution that ensures a seamless experience when a citizen is calling a service center, versus an online interaction, versus a face-to-face one. Maintaining a universal view of the user. Achieved by employing a diverse breadth and depth of data assets and applied analytics, this tactic is the core of modern fraud mitigation and identity management. Knowing the individual user extends beyond a traditional 360-degree view. It means having knowledge of a person’s offline and online behavior, not only with your agency, but also with other agencies with which that user has a relationship. Expanding user view through a blended ecosystem. Increasingly, agencies are participating in a blended ecosystem — working with vendors, peer agencies and partners. There exists a collaborative culture in identity and fraud management that doesn’t exist in more competitive commercial environments. Fraudsters easily share information with one another, so those combatting it need to share information as well. Achieving agility and scale using service-based models. More agencies are adopting service-based models that provide greater agility and response to dynamic fraud threats, diverse population changes, and evolving compliance requirements or guidance. Service-based identity proofing provides government agencies the benefit of regularly updated data assets, analytics and expertise in strategy design. These assets are designed to respond to fraud or identity intelligence observed across various markets and industries, often protecting proactively rather than reactively. Future-proofing fraud solution choices. Technical and operational resources are always in relatively short supply compared to demand. Agencies need the ability to “code once” in order to expand and evolve their fraud strategies with ease. Future-proofing solutions must also be combined with an ever-changing set of identity proofing requirements and best practices, powered by a robust and innovative marketplace of service providers. The future of identity proofing in the public sector is more than just verifying individual identities. New standards in digital identity proofing are a responsive result of mass data compromise and failures in legacy techniques. Achieving compliant and confident identity assurance requires a layered approach, flexibly designed and orchestrated to accommodate diverse identity assertions, evidence, and contextual invocation of technologies and data assets. Government must now use risk-based approaches and mitigation strategies to identity threats quickly and determine the type of fraud before damage is done. Download our recent report in which we discuss the primary challenges of identity proofing in the public sector and what modernization of identity proofing looks like.

Juniper Research recently recognized Experian as a Fraud Detection and Prevention Market Leader in its Online Payment Fraud Whitepaper. Juniper also shared important market insights in the report. The transactional value of card-not-present fraud is estimated to reach $19.3 billion in 2022. Online payment fraud is anticipated to grow 13.7% annually from 2017 to 2022. Digital banking fraud should reach $7.9 billion by 2022. $50.9 billion is expected to be spent on fraud detection and prevention software between 2017 and 2022. Fraud’s not going away anytime soon. Protecting your organization and customers is the new cost of doing business. Don’t wait until 2022 to start protecting yourself. Read the report>

Our national survey found that consumers struggle to find a credit card that meets their needs. They say there are too many options and it’s too time-consuming to research. What do consumers want? With 53% of survey respondents not satisfied with their current cards and 1 in 3 saying they’re likely to get a new card within 6 months, now’s the time to start personalizing offers and growing your portfolio. Start personalizing offers today>

With 1 in 6 U.S. residents being Hispanic, now is a great time for financial institutions to reflect on their largest growth opportunity. Here are 3 misconceptions about the multifaceted Hispanic community that are prevalent in financial institutions: Myth 1: Hispanic consumers are only interested in transaction-based products. In truth, product penetration increases faster among Hispanic members compared with non-Hispanic members when there’s a strategic plan in place. Myth 2: Most Hispanics are undocumented. The facts show that of the country’s more than 52 million Hispanics, most are native-born Americans and nearly 3 in 4 are U.S. citizens. Myth 3: The law prevents us from serving immigrants. Actually, financial institutions can compliantly lend to individuals who have an Individual Taxpayer Identification Number. There are many forms of acceptable government-issued identification, such as passports and consular identification cards. Solidifying the right organizational mentality, developing a comprehensive strategy based on segmentation, and defining what success truly looks like. These are all part of laying the foundation for success with the Hispanic market. Learn more>

We use our laptops and mobile phones every day to communicate with our friends, family, and co-workers. But how do software programs communicate with each other? APIs--Application Programming Interfaces--are the hidden backbone of our modern world, allowing software programs to communicate with one another. Behind the scenes of every app and website we use, is a mesh of systems “talking” to each other through a series of APIs. Today, the API economy is quickly changing how the world interacts. Everything from photo sharing, to online shopping, to hailing a cab is happening through APIs. Because of APIs, technical innovation is happening at a faster pace than ever. We caught up with Edgar Uaje, senior product manager at Experian, to find out more about APIs in the financial services space. What exactly are APIs and why are they so important? And how do they apply to B2B? APIs are the building blocks of many of our applications that exist today. They are an intermediary that allows application programs to communicate, interact, and share data with various operating systems or other control programs. In B2B, APIs allow our clients to consume our data, products, and services in a standard format. They can utilize the APIs for internal systems to feed their risk models or external applications for their customers. As Experian has new data and services available, our clients can quickly access the data and services. Are APIs secure? APIs are secure as long as the right security measures are put in place. There are many security measures that can be utilized such as authentication, authorization, channel encryption and payload encryption. Experian takes security seriously and ensures that the right security measures are put in place to protect our data. For example, one of the recent APIs that was built this year utilizes OAuth, channel encryption, and payload encryption. The central role of APIs is promoting innovation and rapid but stable evolution, but they seem to only have taken hold selectively in much of the business world. Is the world of financial services truly ready for APIs? APIs have been around for a long time, but they are getting much more traction recently. Financial tech and online market place lending companies are leading the charge of consuming data, products, and services through APIs because they are nimble and fast. With standard API interfaces, these companies can move as fast as their development teams can. The world of financial services is evolving, and the time is now for them to embrace APIs in day-to-day business. How can APIs benefit a bank or credit union, for example? APIs can benefit a bank or credit union by allowing them to consume Experian data, products, and services in a standard format. The value to them is faster speed to market for applications (internal/external), ease of integration, and control over the user’s experience. APIs allow a bank or credit union to quickly develop new and innovative applications quickly, with the support of their development teams. Can you tell us more about the API Developer Portal? Experian will publish the documentation of our available APIs on our Developer Portal over time as they become available. Our clients will have a one-stop shop to view available APIs, review API documentation, obtain credentials, and test APIs. This is simplifying data access by utilizing REST API, making it easier for our clients.
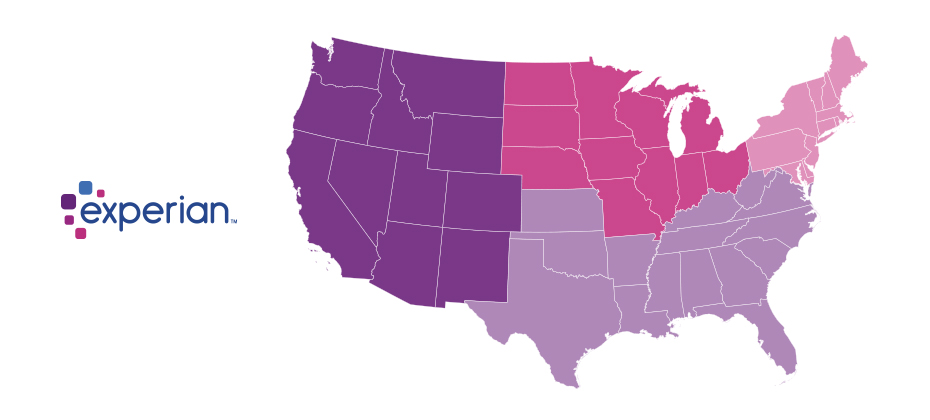
Since the advent of the internet, our lives have changed drastically for the better. We can perform many of life’s daily activities from the comfort of our own home. According to Aite, in 2016 alone 36 million Americans made some form of mobile payment — paying a bill, purchasing something online, paying for fast food or making a mobile wallet purchase at a retailer. Simply put, the internet has made our lives easier. But with the good also comes the bad. While most consumers have moved to the digital world, so have fraudsters. With minimal risk and high reward at stake, e-commerce fraud attacks have increased dramatically over the last few years, with no signs of slowing down. We recently analyzed millions of transactions from the first half of 2017 to identify fraud attack rates based on billing and shipping addresses and broke down the findings into various geographic trends. Fraud attack rates represent the attempted fraudulent e-commerce transactions against the population of overall e-commerce orders. Consumers living out West and in the South have experienced more than their fair share of fraud. During the first half of 2017, the West and the South were the top two regions for both billing and shipping attacks. While both regions were at the top during the same time last year, the attacks themselves have increased substantially. Given the proximity to seaports and major international airports, this is somewhat unsurprising — particularly for shipping fraud — as many fraudsters will leverage reshippers to transport goods soon after delivery. .dataTb{margin:20px auto;width:100%}.dataTb:after{clear:both}.dataTb table{}.dataTb td,.dataTb th{border:1px solid #ddd;padding:.8em}.dataTb th{background:#F4F4F4}.tbL{float:left;width:49%}.tbR{float:right;width:49%;margin:0 0 0 2%} Shipping: Riskiest Regions Region Attack rate West 38.1 South 32.1 Northeast 27.0 North Central 20.7 Billing: Riskiest Regions Region Attack rate West 37.2 South 32.9 Northeast 27.3 North Central 24.0 At the state level, the top three shipping fraud states remained the same as 2016 — Delaware, Oregon and Florida — but the order changed. Oregon was the most targeted, with a fraud rate of 135.2 basis points, more than triple its rate at in the end of 2016. Though no longer in the top spot, Delaware saw alarming spikes as well, with shipping attack rates nearly triple last year’s rate at 128.6 basis points and billing attacks at 79.6 basis points. .dataTb{margin:20px auto;width:100%}.dataTb:after{clear:both}.dataTb table{}.dataTb td,.dataTb th{border:1px solid #ddd;padding:.8em}.dataTb th{background:#F4F4F4}.tbL{float:left;width:49%}.tbR{float:right;width:49%;margin:0 0 0 2%} Shipping: Riskiest States State Attack rate Oregon 135.2 Delaware 128.2 Florida 57.4 New York 45.0 Nevada 36.9 California 36.9 Georgia 33.5 Washington, D.C 30.8 Texas 29.6 Illinois 29.4 Billing: Riskiest States Region Attack rate Oregon 87.5 Delaware 79.6 Washington, D.C. 63.0 Florida 47.4 Nevada 38.8 California 36.9 Arkansas 36.6 New York 35.5 Vermont 34.2 Georgia 33.4 Diving a bit deeper, ZIPTM codes in Miami, Fla., make up a significant portion of the top 10 ZIP CodeTM lists for shipping and billing attacks — in fact, many of the same ZIP codes appear on both lists. The other ZIP Code that appears on both lists is South El Monte, Calif., which has a high percentage of industrial properties — common targets for fraudsters to ship packages, then reship overseas. You can download the top 100 riskiest Zip Codes in the U.S. for H1 2017. .dataTb{margin:20px auto;width:100%}.dataTb:after{clear:both}.dataTb table{}.dataTb td,.dataTb th{border:1px solid #ddd;padding:.8em}.dataTb th{background:#F4F4F4}.tbL{float:left;width:49%}.tbR{float:right;width:49%;margin:0 0 0 2%} Shipping: Top 10 riskiest ZIP™ Codes ZIP Code Attack rate 33122 [Miami, Fla.] 2409.4 91733 [South El Monte, Calif.] 1655.5 33198 [Miami, Fla.] 1295.2 33166 [Miami, Fla.] 1266.0 33195 [Miami, Fla.] 1037.3 33192 [Miami, Fla.] 893.9 97251 [Portland, Ore.] 890.6 07064 [Port Reading, NJ] 808.9 89423 [Minden, Nev.] 685.5 77072 [Houston, Tex.] 629.3 Billing: Top 10 riskiest ZIP™ Codes ZIP Code Attack rate 77060 [Houston, Tex.] 1337.6 33198 [Miami, Fla.] 1215.6 33122 [Miami, Fla.] 1106.2 33166 [Miami, Fla.] 1037.4 91733 [South El Monte, Calif.] 780.1 33195 [Miami, Fla.] 713.7 97252 [Portland, Ore.] 670.8 33191 [Miami, Fla.] 598.8 33708 [St. Petersburg, Fla.] 563.6 33792 [Miami, Fla.] 493.0 As e-commerce fraud continues to grow, businesses need to be proactive to keep themselves and their customers safe. That means incorporating multiple, layered fraud prevention strategies that work together seamlessly — for example, understanding details about users and their devices, knowing how users interact with the business and evaluating previous transaction history. This level of insight can help businesses distinguish real customers from nefarious ones without impacting the customer experience. While businesses are ultimately responsible for the safety of customers and their data, the onus doesn’t rest solely with them. Consumers should also be vigilant when it comes to protecting their digital identities and payment information. That means creating strong, unique passwords; actively monitoring online accounts; and using two-factor authentication to secure account access. At the end of the day, e-commerce fraud is a challenge that businesses and consumers will experience for the foreseeable future. But rising attack rates don’t have to spell doom and gloom for the industry. E-commerce growth is still extremely strong, as consumers interact through multiple channels (in-store, mobile and web) and expect a personalized experience. Establishing trust and verifying digital identities are key to meeting these latest expectations, which provide new opportunities for businesses and consumers to interact seamlessly and transact securely. With multiple safeguards in place, businesses have a variety of options to protect their customers and their brand reputation. Experian is a nonexclusive full-service provider licensee of the United States Postal Service®. The following trademarks are owned by the United States Postal Service®: ZIP and ZIP Code. The price for Experian’s services is not established, controlled or approved by the United States Postal Service.

Leadership and Cybersecurity Multiple studies suggest many executives aren’t as engaged as they should be when ensuring their organizations are prepared to mitigate and manage cybersecurity risks. Insights from our Fourth Annual Data Breach Preparedness Survey, conducted by the Ponemon Institute, support this sentiment. Of the privacy, compliance and IT professionals polled: 57% said their company’s board, chairman and chief executive officer were not informed about or involved in data breach response planning. 60% have leadership who don’t want to know immediately when a material breach occurs. 66% have a board that doesn’t understand the specific cybersecurity threats their organization faces. 74% said their board isn’t willing to take ownership for successful incident response plan implementation. For organizations to protect themselves, cybersecurity professionals need to create greater engagement among the organization’s leadership. Next week, we’ll look at how they can accomplish this. If you’d like, you can jump ahead and read it now. Fourth Annual Data Breach Preparedness Survey

Did you know that 80% of all data migrations fail? Like any large project, data migration relies heavily on many variables. Successful data migration depends on attention to detail, no matter how small. Here are 3 items essential to a successful data migration: Conduct a Pre-Migration Impact Assessment to identify the necessary people, processes and technology needed. Ensure accurate, high-quality data to better streamline the migration process and optimize system functionality. Assemble the right team, including an experienced leader and business users, to ensure timely and on-budget completion. 35% of organizations plan to migrate data this year. If you’re among them, use this checklist to create the right plan, timeline, budget, and team for success.

Create a better consumer experience during the debt collection process When most people think about debt collection, unpleasant images may come to mind, like relentless phone calls or collections notices. Whatever the case may be, the collections process often ends in a less than desirable experience for consumers. And, quite frankly, it needs to change. Steve Platt, Experian’s Group President of Decision Analytics, recently spoke with American Banker regarding how banks and other financial institutions can create a better consumer experience during the debt collection process. While balancing consumer needs and managing rising delinquencies can be a complex challenge, Steve conveyed that the technology and analytics exist to simplify the process. As an industry, we’re at a point where customer acquisition costs far exceed the costs to nurture existing customers through the entire life-cycle - from application to repayment. So, suffice to say, lenders need to rethink how they engage and communicate with their customers. Technology to the rescue Luckily, we live in an era where troves and troves of data are made available every day. We just need to help lenders leverage it to its fullest extent. For example, the right data and technology can help answer questions, such as: What’s the most effective communication channel to reach a customer? When should you contact them? How often? There isn’t a one-size-fits-all approach to debt collection. Each customer is different. Each has their own unique situation. Effective debt collection is about knowing the difference between a customer who has simply forgotten to pay and those who may be struggling financially, and communicating with them accordingly. Go digital Part of knowing how to engage consumers is also understanding we live in a digital world. We perform many of our daily tasks through our mobile devices, desktops or tablets. So, it would make sense for lenders to help their customers manage their past-due accounts virtually. Imagine being able to negotiate payment dates and terms from the privacy of your own home. It just so happens that technology can make this a reality. At the end of the day, the customer needs to be at the heart of the collections strategy. Each customer needs to be communicated with on a case-by-case basis depending on their unique circumstances. The resources exist to make customers feel like individuals, rather than numbers in a spreadsheet. And the lenders that appeal to the customer’s experience will see lower charge-offs and higher customer retention.

School’s out, and graduation brings excitement, anticipation and bills. Oh, boy, here come the student loans. Are graduates ready for the bills? Even before they have a job lined up? With lots of attention from the media, I was interested in analyzing student loan debt to see if this is a true issue or just a headline grab. There’s no shortage of headlines alluding to a student loan crisis: “How student loans are crushing millennial entrepreneurialism” “Student loan debt in 2017: A $1.3 trillion crisis” “Why the student loan crisis is even worse than people think” Certainly sounds like a crisis. However, I’m a data guy, so let’s look at the data. Pulling from our data, I analyzed student loan trades for the last four years starting with outstanding debt — which grew 21 percent since 2013 to reach a high of $1.49 trillion in the fourth quarter of 2016. I then drilled down and looked at just student loan trades. Created with Highstock 5.0.7Total Number of Student Loans TradesStudent Loan Total TradesNumber of trades in millions174,961,380174,961,380182,125,450182,125,450184,229,650184,229,650181,228,130181,228,130Q4 2013Q4 2014Q4 2015Q4 2016025M50M75M100M125M150M175M200MSource: Experian (function(){ function include(script, next) {var sc=document.createElement("script");sc.src = script;sc.type="text/javascript";sc.onload=function() {if (++next < incl.length) include(incl[next], next);};document.head.appendChild(sc);}function each(a, fn){if (typeof a.forEach !== "undefined"){a.forEach(fn);}else{for (var i = 0; i < a.length; i++){if (fn) {fn(a[i]);}}}}var inc = {},incl=[]; each(document.querySelectorAll("script"), function(t) {inc[t.src.substr(0, t.src.indexOf("?"))] = 1;});each(Object.keys({"https://code.highcharts.com/stock/highstock.js":1,"https://code.highcharts.com/adapters/standalone-framework.js":1,"https://code.highcharts.com/highcharts-more.js":1,"https://code.highcharts.com/highcharts-3d.js":1,"https://code.highcharts.com/modules/data.js":1,"https://code.highcharts.com/modules/exporting.js":1,"http://code.highcharts.com/modules/funnel.js":1,"http://code.highcharts.com/modules/solid-gauge.js":1}),function (k){if (!inc[k]) {incl.push(k)}});if (incl.length > 0) { include(incl[0], 0); } function cl() {if(typeof window["Highcharts"] !== "undefined"){new Highcharts.Chart("highcharts-79eb8e0a-4aa9-404c-bc5f-7da876c38b0f", {"chart":{"type":"column","inverted":true,"polar":false,"style":{"fontFamily":"Arial","color":"#333","fontSize":"12px","fontWeight":"normal","fontStyle":"normal"}},"plotOptions":{"series":{"dataLabels":{"enabled":true},"animation":true}},"title":{"text":"Student Loan Total Trades","style":{"fontFamily":"Arial","color":"#333333","fontSize":"18px","fontWeight":"bold","fontStyle":"normal","fill":"#333333","width":"792px"}},"subtitle":{"text":"","style":{"fontFamily":"Arial","color":"#666666","fontSize":"16px","fontWeight":"normal","fontStyle":"normal","fill":"#666666","width":"792px"}},"exporting":{},"yAxis":[{"title":{"text":"Number of trades in millions","style":{"fontFamily":"Arial","color":"#666666","fontSize":"16px","fontWeight":"normal","fontStyle":"normal"}},"labels":{"format":""},"type":"linear"}],"xAxis":[{"title":{"style":{"fontFamily":"Arial","color":"#666666","fontSize":"16px","fontWeight":"normal","fontStyle":"normal"},"text":""},"reversed":true,"labels":{"format":"{value:}"},"type":"linear"}],"series":[{"data":[["Total Student Loans",174961380]],"name":"Q4 2013","turboThreshold":0,"_colorIndex":0,"_symbolIndex":0},{"data":[["Total Student Loans",182125450]],"name":"Q4 2014","turboThreshold":0,"_colorIndex":1,"_symbolIndex":1},{"data":[["Total Student Loans",184229650]],"name":"Q4 2015","turboThreshold":0,"_colorIndex":2,"_symbolIndex":2},{"data":[["Total Student Loans",181228130]],"name":"Q4 2016","turboThreshold":0,"_colorIndex":3,"_symbolIndex":3}],"colors":["#26478d","#406eb3","#632678","#982881"],"legend":{"itemStyle":{"fontFamily":"Arial","color":"#333333","fontSize":"12px","fontWeight":"normal","fontStyle":"normal","cursor":"pointer"},"itemHiddenStyle":{"fontFamily":"Arial","color":"#cccccc","fontSize":"18px","fontWeight":"normal","fontStyle":"normal"},"layout":"horizontal","floating":false,"verticalAlign":"bottom","x":0,"align":"center","y":0},"credits":{"text":"Source: Experian"}});}else window.setTimeout(cl, 20);}cl();})(); Over the past four years, student loan trades grew 4 percent, but saw a slight decline between 2015 and 2016. The number of trades isn’t growing as fast as the amount of money that people need. The average balance per trade grew 17 percent to $8,210. Either people are not saving enough for college or the price of school is outpacing the amount people are saving. I shifted the data and looked at the individual consumer rather than the trade level. Created with Highstock 5.0.7Student Loan Average Balance per Trade4.044.043.933.933.893.893.853.85Q4 2013Q4 2014Q4 2015Q4 201600.511.522.533.544.5Source: Experian (function(){ function include(script, next) {var sc=document.createElement("script");sc.src = script;sc.type="text/javascript";sc.onload=function() {if (++next < incl.length) include(incl[next], next);};document.head.appendChild(sc);}function each(a, fn){if (typeof a.forEach !== "undefined"){a.forEach(fn);}else{for (var i = 0; i < a.length; i++){if (fn) {fn(a[i]);}}}}var inc = {},incl=[]; each(document.querySelectorAll("script"), function(t) {inc[t.src.substr(0, t.src.indexOf("?"))] = 1;});each(Object.keys({"https://code.highcharts.com/stock/highstock.js":1,"https://code.highcharts.com/adapters/standalone-framework.js":1,"https://code.highcharts.com/highcharts-more.js":1,"https://code.highcharts.com/highcharts-3d.js":1,"https://code.highcharts.com/modules/data.js":1,"https://code.highcharts.com/modules/exporting.js":1,"http://code.highcharts.com/modules/funnel.js":1,"http://code.highcharts.com/modules/solid-gauge.js":1}),function (k){if (!inc[k]) {incl.push(k)}});if (incl.length > 0) { include(incl[0], 0); } function cl() {if(typeof window["Highcharts"] !== "undefined"){new Highcharts.Chart("highcharts-66c10c16-1925-40d2-918f-51214e2150cf", {"chart":{"type":"column","polar":false,"style":{"fontFamily":"Arial","color":"#333","fontSize":"12px","fontWeight":"normal","fontStyle":"normal"},"inverted":true},"plotOptions":{"series":{"dataLabels":{"enabled":true},"animation":true}},"title":{"text":"Student Loan Average Number of Trades per Consumer","style":{"fontFamily":"Arial","color":"#333333","fontSize":"18px","fontWeight":"bold","fontStyle":"normal","fill":"#333333","width":"356px"}},"subtitle":{"text":"","style":{"fontFamily":"Arial","color":"#666666","fontSize":"16px","fontWeight":"normal","fontStyle":"normal","fill":"#666666","width":"356px"}},"exporting":{},"yAxis":[{"title":{"text":"","style":{"fontFamily":"Arial","color":"#666666","fontSize":"14px","fontWeight":"normal","fontStyle":"normal"}},"type":"linear","labels":{"format":"{value}"}}],"xAxis":[{"title":{"style":{"fontFamily":"Arial","color":"#666666","fontSize":"14px","fontWeight":"normal","fontStyle":"normal"}},"type":"linear","labels":{"format":"{}"}}],"colors":["#26478d","#406eb3","#632678","#982881","#ba2f7d"],"series":[{"data":[["Average Trades per Consumer",4.04]],"name":"Q4 2013","turboThreshold":0,"_colorIndex":0},{"data":[["Average Trade per Consumer",3.93]],"name":"Q4 2014","turboThreshold":0,"_colorIndex":1},{"data":[["Average Trade per Consumer",3.89]],"name":"Q4 2015","turboThreshold":0,"_colorIndex":2},{"data":[["Average Trades per Consumer",3.85]],"name":"Q4 2016","turboThreshold":0,"_colorIndex":3}],"legend":{"floating":false,"itemStyle":{"fontFamily":"Arial","color":"#333333","fontSize":"12px","fontWeight":"bold","fontStyle":"normal","cursor":"pointer"},"itemHiddenStyle":{"fontFamily":"Arial","color":"#cccccc","fontSize":"18px","fontWeight":"normal","fontStyle":"normal"},"layout":"horizontal"},"credits":{"text":"Source: Experian"}});}else window.setTimeout(cl, 20);}cl();})(); The number of overall student loan trades per consumer is down to 3.85, a decrease of 5 percent over the last four years. This is explained by an increase in loan consolidations as well as the better planning by students so that they don’t have to take more student loans in the same year. Lastly, I looked at the average balance per consumer. This is the amount that consumers, on average, owe for their student loan trades. Created with Highstock 5.0.7Balance in thousands ($)Quarterly $USD Debt per ConsumerQ4 Student Loan TrendsAverage Student Loan Debt Balance per Consumer27,93427,93429,22629,22630,52330,52332,06132,061Q4 2013Q4 2014Q4 2015Q4 201605,00010,00015,00020,00025,00030,00035,000Source: Experian (function(){ function include(script, next) {var sc=document.createElement("script");sc.src = script;sc.type="text/javascript";sc.onload=function() {if (++next < incl.length) include(incl[next], next);};document.head.appendChild(sc);}function each(a, fn){if (typeof a.forEach !== "undefined"){a.forEach(fn);}else{for (var i = 0; i < a.length; i++){if (fn) {fn(a[i]);}}}}var inc = {},incl=[]; each(document.querySelectorAll("script"), function(t) {inc[t.src.substr(0, t.src.indexOf("?"))] = 1;});each(Object.keys({"https://code.highcharts.com/stock/highstock.js":1,"https://code.highcharts.com/adapters/standalone-framework.js":1,"https://code.highcharts.com/highcharts-more.js":1,"https://code.highcharts.com/highcharts-3d.js":1,"https://code.highcharts.com/modules/data.js":1,"https://code.highcharts.com/modules/exporting.js":1,"http://code.highcharts.com/modules/funnel.js":1,"http://code.highcharts.com/modules/solid-gauge.js":1}),function (k){if (!inc[k]) {incl.push(k)}});if (incl.length > 0) { include(incl[0], 0); } function cl() {if(typeof window["Highcharts"] !== "undefined"){Highcharts.setOptions({lang:{"thousandsSep":","}});new Highcharts.Chart("highcharts-0b893a55-8019-4f1a-9ae1-70962e668355", {"chart":{"type":"column","inverted":true,"polar":false,"style":{"fontFamily":"Arial","color":"#333","fontSize":"12px","fontWeight":"normal","fontStyle":"normal"}},"plotOptions":{"series":{"dataLabels":{"enabled":true},"animation":true}},"title":{"text":"Average Student Loan Balance per Consumer","style":{"fontFamily":"Arial","color":"#333333","fontSize":"18px","fontWeight":"bold","fontStyle":"normal","fill":"#333333","width":"308px"}},"subtitle":{"text":"","style":{"fontFamily":"Arial","color":"#666666","fontSize":"16px","fontWeight":"normal","fontStyle":"normal","fill":"#666666","width":"792px"}},"exporting":{},"yAxis":[{"title":{"text":"Balance numbers are in thousands ($)","style":{"fontFamily":"Arial","color":"#666666","fontSize":"16px","fontWeight":"normal","fontStyle":"normal"}},"labels":{"format":"{value:,1f}"},"reversed":false}],"xAxis":[{"title":{"style":{"fontFamily":"Arial","color":"#666666","fontSize":"16px","fontWeight":"normal","fontStyle":"normal"},"text":"Balance in thousands ($)"},"labels":{"format":"{value:}"},"type":"linear","reversed":true,"opposite":false}],"series":[{"data":[["Average Balance per Consumer",27934]],"name":"Q4 2013","turboThreshold":0,"_colorIndex":0},{"data":[["Average Balance per Consumer",29226]],"name":"Q4 2014","turboThreshold":0,"_colorIndex":1},{"data":[["Average Balance per Consumer",30523]],"name":"Q4 2015","turboThreshold":0,"_colorIndex":2},{"data":[["Average Balance per Consumer",32061]],"name":"Q4 2016","turboThreshold":0,"_colorIndex":3}],"colors":["#26478d","#406eb3","#632678","#982881"],"legend":{"itemStyle":{"fontFamily":"Arial","color":"#333333","fontSize":"12px","fontWeight":"bold","fontStyle":"normal","cursor":"pointer"},"itemHiddenStyle":{"fontFamily":"Arial","color":"#cccccc","fontSize":"18px","fontWeight":"normal","fontStyle":"normal"}},"lang":{"thousandsSep":","},"credits":{"text":"Source: Experian"}});}else window.setTimeout(cl, 20);}cl();})(); Here we see a growth of 15 percent over the last four years. At the end of 2016, the average person with a student loan balance had just over $32,000 outstanding. While this is a large increase, we should compare it with other purchases: This balance is no more than a person purchasing a brand-new car without a down payment. While we’re seeing an increase in overall outstanding debt and individual loan balances, I’m not yet agreeing that this is the crisis the media portrays. If students are educated about the debt that they’re taking out and making sure that they’re able to repay it, the student loan market is performing as it should. It’s our job to help educate students and their families about making good financial decisions. These discussions need to be had before debt is taken out, so it’s not a shock to the student upon graduation.

Experian’s annual Vision Conference, a four-day event designed to bring business leaders together to discuss the latest ideas and solutions surrounding targeting new markets, growing customer bases and profitability, reducing fraud and more, begins Sunday evening in Orlando, Florida. Over the course of the week, a total of 65 sessions will touch on newsworthy and breaking trends. Attendees will discover: The latest generational insights – including a first look at the coming-of-age Gen Z crowd – regarding credit scores, spend patterns and digital behaviors Multiple presentations on the economy, the mortgage market, student lending, small business forecasts and new developments in online marketplace lending Deep dives on fraud in relation to the epidemic of synthetic IDs, Know Your Customer (KYC) compliance strategies, maturing your organization to defeat fraud, and the dark web Regulatory round-ups touching on everything from the Military Lending Act (MLA), the Telephone Consumer Protection Act (TCPA), Current Expected Credit Loss (CECL) and what is emerging from the new administration Best-in-class sessions on data and analytics, modeling, virtual collections, trended data and credit marketing Intel on the state of commercial lending, the rise of the mircopreneur and the business credit profile across various life stages. Beyond a jam-packed schedule of breakout sessions, the conference will additionally host a series of general session speakers sure to educate and entertain. On Monday, Steve Wozniak, also known as “The Woz” takes the stage to talk about his experiences as co-founder of Apple Computer Inc. and his years in the emerging technology space. Diane Swonk, CEO of DS Economics, will address the crowd on Tuesday to provide details and analysis on the state of the global and U.S. economies. Finally, legendary quarterback and recent Super Bowl MVP and winner Tom Brady will speak on Wednesday to close out the event. Conference attendees can follow everything utilizing their Experian Vision app. Hot stats, pictures and event news will also be shared on multiple social handles using #ExperianVision.