Uncategorized

James W. Paulsen, Chief Investment Strategist for Wells Capital Management, kicked off the second day of Experian’s Vision 2016, sharing his perspective on the state of the economy and what the future holds for consumers and businesses alike. Paulsen joked this has been “the most successful, disappointing recovery we’ve ever had.” While media and lenders project fear for a coming recession, Paulsen stated it is important to note we are in the 8th year of recovery in the U.S., the third longest in U.S. history, with all signs pointing to this recovery extending for years to come. Based on his indicators – leverage, restored household strength, housing, capital spending and better global growth – there is still capacity to grow. He places recession risk at 20 to 25 percent – and only quotes those numbers due the length of the recovery thus far. “What is the fascination with crisis policies when there is no crisis,” asks Paulsen. “I think we have a good chance of being in the longest recovery in U.S. history.” Other noteworthy topics of the day: Fraud prevention Fraud prevention continues to be a hot topic at this year’s conference. Whether it’s looking at current fraud challenges, such as call-center fraud, or looking to future-proof an organization’s fraud prevention techniques, the need for flexible and innovative strategies is clear. With fraudsters being quick, and regularly ahead of the technology fighting them, the need to easily implement new tools is fundamental for you to protect your businesses and customers. More on Regulatory The Military Lending Act has been enhanced over the past year to strengthen protections for military consumers, and lenders must be ready to meet updated regulations by fall 2016. With 1.46 million active personnel in the U.S., all lenders are working to update processes and documentation associated with how they serve this audience. Alternative Data What is it? How can it be used? And most importantly, can this data predict a consumer’s credit worthiness? Experian is an advocate for getting more entities to report different types of credit data including utility payments, mobile phone data, rental payments and cable payments. Additionally, alternative data can be sourced from prepaid data, liquid assets, full file public records, DDA data, bill payment, check cashing, education data, payroll data and subscription data. Collectively, lenders desire to assess someone’s stability, ability to pay and willingness to repay. If alternative data can answer those questions, it should be considered in order to score more of the U.S. population. Financial Health The Center for Financial Services Innovation revealed insights into the state of American’s financial health. According to a study they conducted, 57 percent of Americans are not financially healthy, which equates to about 138 million people. As they continue to place more metrics around defining financial health, the center has landed on four components: how people plan, spend, save and borrow. And if you think income is a primary factor, think again. One-third of Americans making more than $60k a year are not healthy, while one-third making less than $60k a year are healthy. --- Final Vision 2016 breakouts, as well as a keynote from entertainer Jay Leno, will be delivered on Wednesday.

It’s impossible to capture all of the insights and learnings of 36 breakout sessions and several keynote addresses in one post, but let’s summarize a few of the highlights from the first day of Vision 2016. 1. Who better to speak about the state of our country, specifically some of the threats we are facing than Leon Panetta, former Secretary of Defense and Director of the CIA. While we are at a critical crossroads in the United States, there is room for optimism and his hope that we can be an America in Renaissance. 2. Alex Lintner, Experian President of Consumer Information Services, conveyed how the consumer world has evolved, in large part due to technology: 67 percent of consumers made purchases across multiple channels in the last six months. More than 88M U.S. consumers use their smartphone to do some form of banking. 68 percent of Millennials believe within five years the way we access money will be totally different. 3. Peter Renton of Lend Academy spoke on the future of Online Marketplace Lending, revealing: Banks are recognizing that this industry provides them with a great opportunity and many are partnering with Online Marketplace Lenders to enter the space. Millennials are not the largest consumers in this space today, but they will be in the future. Sustained growth will be key for this industry. The largest platforms have everything they need in place to endure – even through an economic downturn.In other words, Online Marketplace Lenders are here to stay. 4. Tom King, Experian’s Chief Information Security Officer, addressed the crowds on how the world of information security is growing increasingly complex. There are 1.9 million records compromised every day, and sadly that number is expected to rise. What can businesses do? “We need to make it easier to make the bad guys go somewhere else,” says King. 5. Look at how the housing market has changed from just a few years ago: Inventory continues to be extraordinarily lean. Why? New home building continues to run at recession levels. And, 8.5 percent of homeowners are still underwater on their mortgage, preventing them from placing it on the market. In the world of single-family home originations, 2016 projections show that there will be more purchases, less refinancing and less volume. We may see further growth in HELOC’s. With a dwindling number of mortgages benefiting from refinancing, and with rising interest rates, a HELOC may potentially be the cheapest and easiest way to tap equity. 6. As organizations balance business needs with increasing fraud threats, the important thing to remember is that the customer experience will trump everything else. Top fraud threats in 2015 included: Card Not Present (CNP) First Party Fraud/Synthetic ID Application Fraud Mobile Payment/Deposit Fraud Cross-Channel FraudSo what do the experts believe is essential to fraud prevention in the future? Big Data with smart analytics. 7. The need for Identity Relationship Management can be seen by the dichotomy of “99 percent of companies think having a clear picture of their customers is important for their business; yet only 24 percent actually think they achieve this ideal.” Connecting identities throughout the customer lifecycle is critical to bridging this gap. 8. New technologies continue to bring new challenges to fraud prevention. We’ve seen that post-EMV fraud is moving “upstream” as fraudsters: Apply for new credit cards using stolen ID’s. Provision stolen cards into mobile wallet. Gain access to accounts to make purchases.Then, fraudsters are open to use these new cards everywhere. 9. Several speakers addressed the ever-changing regulatory environment. The Telephone Consumer Protection Act (TCPA) litigation is up 30 percent since the last year. Regulators are increasingly taking notice of Online Marketplace Lenders. It’s critical to consider regulatory requirements when building risk models and implementing business policies. 10. Hispanics and Millennials are a force to be reckoned with, so pay attention: Millennials will be 81 million strong by 2036, and Hispanics are projected to be 133 million strong by 2050. Significant factors for home purchase likelihood for both groups include VantageScore® credit score, age, student debt, credit card debt, auto loans, income, marital status and housing prices. More great insights from Vision coming your way tomorrow!

It’s one of our favorite times of year. Yes, spring is in the air, and we’re delighted to spend a few days away from the office in picturesque Scottsdale, Arizona. But what really has us excited is the opportunity to connect with a diverse network of industry leaders from across the country at our 35th annual Vision Conference. We have a full agenda, featuring sessions on advanced data analytics, market trends, fraud and identity, regulatory hot topics and more. And our theme for this year is geared toward giving participants the tools and insights they need to take control of their respective businesses to grow new markets, increase existing customer bases, reduce fraud and increase profits. In addition to 70-plus breakout session, guests will be treated to several keynote addresses: Leon Panetta, former U.S. Secretary of defense and former Director of the CIA James W. Paulsen, Chief Investment Strategist, Wells Capital Management Jay Leno, Television Host, Author and Comedian Listen to Experian North America CEO Craig Boundy’s welcome message, and start your Vision three-day event with the goal of meeting and engaging with as many old and new contacts as possible. For individuals not attending this year’s Vision, stay tuned for learnings and insights that will be shared in the coming weeks. Attendees and non-attendees alike can also follow updates on Twitter and via #vision2016.

This article first appeared in Baseline Magazine Since it is possible for cyber-criminals to create a synthetic person, businesses must be able to differentiate between synthetic and true-party identities. Children often make up imaginary friends and have a way of making them come to life. They may come over to play, go on vacation with you and have sleepover parties. As a parent, you know they don’t really exist, but you play along anyway. Think of synthetic identities like imaginary friends. Unfortunately, some criminals create imaginary identities for nefarious reasons, so the innocence associated with imaginary friends is quickly lost. Fraudsters combine and manipulate real consumer data with fictitious demographic information to create a “new” or “synthetic” individual. Once the synthetic person is “born,” fraudsters create a financial life and social history that mirrors true-party behaviors. The similarities in financial activities make it difficult to detect good from bad and real from synthetic. There really is no difference in the world of automated transaction processing between you and a synthetic identity. Often the synthetic “person” is viewed as a thin or shallow file consumer— perhaps a millennial. I have a hard time remembering all of my own passwords, so how do organized “synthetic schemes” keep all the information usable and together across hundreds of accounts? Our data scientists have found that information is often shared from identity to identity and account to account. For instance, perhaps synthetic criminals are using the same or similar passwords or email addresses across products and accounts in your portfolio. Or, perhaps physical address and phone records have cross-functional similarities. The algorithms and sciences are much more complex, but this simplifies how we are able to link data, analytics, strategies and scores. Identifying the Business Impact of Synthetic-Identity Fraud Most industry professionals look at synthetic-identity fraud as a relatively new fraud threat. The real risk runs much deeper in an organization than just operational expense and fraud loss dollars. Does your fraud strategy include looking at all types of risk, compliance reporting, and how processes affect the customer experience? To identify the overall impact synthetic identities can have on your institution, you should start asking: Are you truly complying with "Know Your Customer" (KYC) regulations when a synthetic account exists in your active portfolio? Does your written "Customer Identification Program" (CIP) include or exclude synthetic identities? Should you be reporting this suspicious activity to the compliance officer (or department) and submitting a suspicious activity report (SAR)? Should you charge off synthetic accounts as credit or fraud losses? Which department should be the owner of suspected synthetic accounts: Credit Risk, Collections or Fraud? Do you have run any anti-money laundering (AML) risk when participating in money movements and transfers? Depending on your answers to the above questions, you may be incurring potential risks in the policies and procedures of synthetic identity treatment, operational readiness and training practices. Since it is possible to create a synthetic person, businesses must be able to differentiate between synthetic and true-party identities, just as parents need to differentiate between their child's real and imaginary friends.

Businesses are looking to international markets to fuel growth, but meeting regulatory requirements across the globe poses significant challenges. Changes in Anti-Money Laundering (AML) and Know Your Customer (KYC) requirements are evolving at break-neck speed. In the past few years, financial institutions and corporations have incurred billions of dollars in fines, reputation damage, and even the possibility of criminal prosecution for not enforcing adequate regulatory controls. KPMG found that 70 percent of its respondents had received a regulatory visit within the past year focused on KYC and total investment in AML had increased by an average rate of 53 percent. As large as this additional investment may seem, there may be an even bigger cost to doing regulatory compliance the right way. For many businesses the customer experience is the biggest casualty of implementing a robust KYC program. In their Vision 2016 breakout session “Know your customer, meeting commercial requirements in a global marketplace,” Greg Carmean, Experian senior product manager, will be joined by Adel Shrufi, software development manager at Amazon Transaction Risk Management Systems. They will discuss: • How to streamline compliance to optimize the client experience • How to evaluate and select the best vendors to reduce compliance costs and operational vulnerabilities • What businesses need to consider to ensure successful launches in new international markets Watch our session preview video below: We’ll look forward to seeing you as we provide a road map for growth at this year’s Vision conference.

Device emulators — wolves in sheep’s clothing Despite all the fraud prevention systems and resources in the public and private sectors, online fraud continues to grow at an alarming rate, offering a low-risk, high-reward proposition for fraudsters. Unfortunately, the Web houses a number of easily accessible tools that criminals can use to perpetrate fraud and avoid detection. The device emulator is one of these tools. Simply put, a device emulator is one device that pretends to be another. What began as innovative technology to enable easy site testing for Web developers quickly evolved into a universally available tool that attackers can exploit to wreak havoc across all industry verticals. While it’s not new technology, there has been a significant increase in its use by criminals to deceive simple device identification and automated risk-management solutions to carry out fraudulent activities. Suspected device emulation (or spoofing) traffic historically has been difficult to identify because fraud solutions rely heavily on reputation databases or negative lists. Detecting and defeating these criminals in sheep’s clothing is possible, however. Leveraging Experian’s collective fraud intelligence and data modeling expertise, our fraud research team has isolated several device attributes that can identify the presence of an emulator being used to submit multiple transactions. Thanks to these latest FraudNet rule sets, financial institutions, ecommerce merchants, airlines, insurers and government entities alike now can uncloak and protect against many of these cybercriminals. Unfortunately, device emulators are just one of many tools available to criminals on the Dark Web. Join me at Vision 2016, where U.S. Secret Service and I will share more tales from the Dark Web. We will explore the scale of the global cybercrime problem, walk through the anatomy of a typical hack, explain how hackers exploit browser plug-ins, and describe how enhanced device intelligence and visibility across all channels can stop fraudsters in their tracks. Listen to Mike Gross as he shares a short overview of his Vision 2016 breakout session in this short video. Don’t miss this innovative Vision 2016 session! See you there.
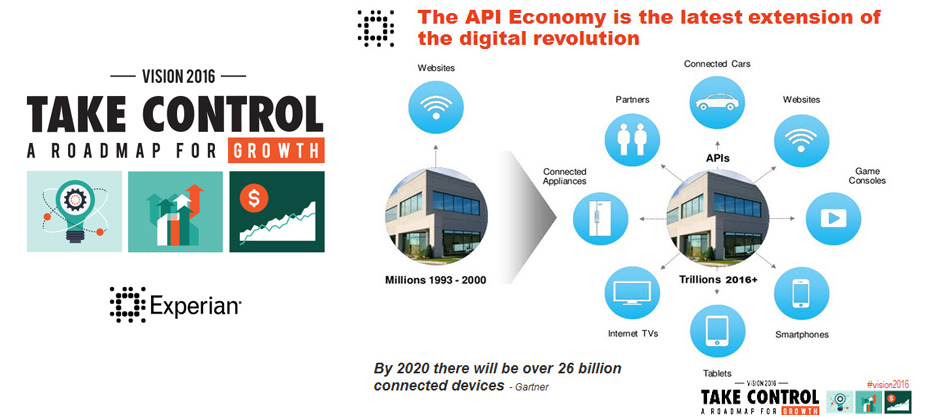
There is a revolution going on! We are in the midst of the second phase of the digital revolution and it is being fueled by API’s. API’s provide the access and mapping that allow access to and integration of the myriad of existing and new data sources available today. They do really helpful things like allow Uber to revolutionize the connection of riders to drivers as well as allow for quick, self-service credit decisions by integrating Experian data within Salesforce.com. Digital disruptors like Uber have scaled their business to massive size at breakneck speed because they can design, build and deploy solutions quickly. API’s and cloud computing play a central role in all of this. You will hear representatives from Uber share how API’s enabled the flow of Experian data through Salesforce.com enabling them to launch new business models, and enter new markets. Listen to Mike Myers as he shares a short overview of his Vision 2016 breakout session in this short video. Don’t miss this innovative Vision 2016 session! See you there.
Small business trade payment delinquencies can signal the beginning of business financial duress. However, sometimes these delinquencies are isolated events. Understanding the trade payment priorities of a business can lead to better business risk assessment. Experian understands commercial payment behaviors and can help clients more accurately interpret the risk of payment delinquencies for different kinds of trades. In his Vision 2016 breakout session “Which creditors get priority when businesses face a financial burden”, Sung Park, Analytics Consultant with Experian’s Decision Sciences discusses the types of trades or financial obligations that become delinquent first, and the conditions that most commonly signal overall business stress. What the audience will learn: The audience will have a better understanding of which type of trade delinquencies are likely isolated incidents and which ones are precursors of businesses facing a financial burden, and what actions can be taken proactively to mitigate risk. Don't miss your opportunity to catch these informative breakout sessions during Vision 2016.

Identity management traditionally has been made up of creating rigid verification processes that are applied to any access scenario. But the market is evolving and requiring an enhanced Identity Relationship Management strategy and framework. Simply knowing who a person is at one point in time is not enough. The need exists to identify risks associated with the entire identity profile, including devices, and the context in which consumers interact with businesses, as well as to manage those risks throughout the consumer journey. The reasoning for this evolution in identity management is threefold: size and scope, flexible credentialing and adaptable verification. First, deploying a heavy identity and credentialing process across all access scenarios is unnecessarily costly for an organization. While stringent verification is necessary to protect highly sensitive information, it may not be cost-effective to protect less-valuable data with the same means. A user shouldn’t have to go through an extensive and, in some cases, invasive form of identity verification just to access basic information. Second, high-friction verification processes can impede users from accessing services. Consumers do not want to consistently answer multiple, intrusive questions in order to access basic information. Similarly, asking for personal information that already may have been compromised elsewhere limits the effectiveness of the process and the perceived strength in the protection. Finally, an inflexible verification process for all users will detract from a successful customer relationship. It is imperative to evolve your security interactions as confidence and routines are built. Otherwise, you risk severing trust and making your organization appear detached from consumer needs and preferences. This can be used across all types of organizations — from government agencies and online retailers to financial institutions. Identity Relationship Management has three unique functions delivered across the Customer Life Cycle: Identity proofing Authentication Identity management Join me at Vision 2016 for a deeper analysis of Identity Relationship Management and how clients can benefit from these new capabilities to manage risk throughout the Customer Life Cycle. I look forward to seeing you there!

Proven identity and device authentication to minimize identity tax return fraud Identity fraud places an enormous burden on its victims and presents a challenge to businesses, organizations and government agencies, including the IRS and all state revenue authorities. Tax return fraud occurs when an attacker uses a consumer’s stolen Social Security number and other personal information to file a tax return, often claiming a significant refund. The IRS is challenged by innovative fraudsters continually trying to outsmart its current risk strategies around prevention, detection, recovery and victim assistance. And with the ever-increasing number of identity data compromised and tax return fraud victims, it’s necessary to question whether tax preparation companies are doing all they can to keep personally identifiable information (PII) secure and screen for fraud before forms are submitted. “ID theft isn’t just credit card fraud,” said Rod Griffin, Director of Public Education for Experian. A recent Experian online survey indicated that nearly 76 percent of consumers are familiar with ID theft and tax fraud — up significantly from the past two years. And 28 percent of those surveyed have been a victim or know a victim of tax fraud. To protect all parties’ interests, tax preparation agencies are challenged by today’s savvy fraudsters who have reaped the benefits of recent breaches. In order to protect consumers, organizations need to apply comprehensive, data-driven intelligence to help thwart identity fraud and the use of stolen identity data via fraudulent returns. The key to securing transactions, reducing friction and providing a consistently satisfying customer experience, online and offline, is authenticating consumers in a clear and frictionless environment. As a result, it’s necessary to have reliable customer intelligence based on both high-quality contextual identity and device attributes alongside other authentication performance data. Comprehensive customer intelligence means having a holistic, bound-together view of devices and identities that equips companies and agencies with the tools to balance cost and risk without increasing transactional friction. Businesses and agencies must not rely on a singular point of customer intelligence gathering and decisioning, but must move to more complex device identification and out-of-wallet verification procedures. Effective solutions typically involve a layered approach with several of the following: Identity transaction link analysis and risk attribute derivation Device intelligence and risk assessment Credit and noncredit data and risk attributes Multifactor authentication, using one-time passcodes via SMS messaging Identity risk scores Dynamic knowledge-based authentication questions Traditional PII validation and verification Biometrics and remote document verification Out-of-band alerts, communications and confirmations Contextual account, transaction and channel purview Additionally, government agencies must adhere to recognized standards, such as those prescribed by the National Institute of Standards and Technology to establish compliance. The persistent threat of tax fraud highlights the urgent need for businesses and agencies to continue educating consumers and more importantly, to improve the strategic effectiveness of their current solutions processes. Learn more about Experian Fraud and Identity Solutions, including government-specific treatments, and how the most effective fraud prevention and identity authentication strategy leverages multiple detection capabilities to highlight attackers while enabling a seamless, positive experience for legitimate consumers.

Loyalty fraud and the customer experience Criminals continue to amaze me. Not surprise me, but amaze me with their ingenuity. I previously wrote about fraudsters’ primary targets being those where they easily can convert credentials to cash. Since then, a large U.S. retailer’s rewards program was attacked – bilking money from the business and causing consumers confusion and extra work. This attack was a new spin on loyalty fraud. It is yet another example of the impact of not “thinking like a fraudster” when developing a program and process, which a fraudster can exploit. As it embarks on new projects, every organization should consider how it can be exploited by criminals. Too often, the focus is on the customer experience (CX) alone, and many organizations will tolerate fraud losses to improve the CX. In fact, some organization build fraud losses into their budgets and price products accordingly — effectively passing the cost of fraud onto the consumers. Let’s look into how this type of loyalty fraud works. The criminal obtains your login credentials (either through breach, malware, phishing, brute force, etc.) and uses the existing customer profile to purchase goods using the payment method on file for the account. In this type of attack, the motivation isn’t to receive physical goods; instead, it’s to accumulate rewards points — which can then be used or sold. The points (or any other form of digital currency) are instant — on demand, if you will — and much easier to fence. Once the points are credited to the account, the criminal cashes them out either by selling them online to unsuspecting buyers or by walking into a store, purchasing goods and walking right out after paying with the digital currency. A quick check of some underground forums validates the theory that fraudsters are selling retailer points online for a reduced rate — up to 70 percent off. Please don’t be tempted to buy these! The money you spend will no doubt end up doing harm, one way or another. Now, back to the customer experience. Does having lax controls really represent a good customer experience? Is building fraud losses into the cost of your products fair to your customers? The people whose accounts have been hacked most likely are some of your best customers. They now have to deal with returning merchandise they didn’t purchase, making calls to rectify the situation, having their personally identifiable information further compromised and having to pay for the loss. All in all, not a great customer experience. All businesses have a fiduciary responsibility to protect customer data with which they have been entrusted — even if the consumer is a victim of malware, phishing or password reuse. What are you doing to protect your customers? Simple authentication technologies, while nice for the CX, easily can fail if the criminal has access to the login credentials. And fraud is not a single event. There are patterns and surveillance activities that can help to detect fraud at every phase of your loyalty program — from new account opening to account logins and updates to transactions that involve the purchase of goods or the movement of currency. As fraudsters continue to evolve and look for the least-protected targets, loyalty programs have come to the forefront of the battleground. Take the time to understand your vulnerability and how you can be attacked. Then take the necessary steps to protect your most profitable customers — your loyalty program members. If you want to learn more, join us MRC Vegas 16 for our session “Loyalty Fraud; It’s Brand Protection, Not Just Loss Prevention” and hear our industry experts discuss loyalty fraud, why it’s lucrative, and what organizations can do to protect their brand from this grey-area type of fraud.

Over the next several years, the large number of home equity lines of credit (also known as HELOCs) originated during the boom period of 2005 to 2008, will begin approaching their end of draw periods. Upon entering the repayment period, these 10-year interest-only loans will become amortized to cover both principal and interest, resulting in payment shock for many borrowers. HELOCs representing $265 billion will reach their end of draw between 2015 and 2018. Now is the time for lenders to be proactive and manage this risk effectively. Lenders with HELOC portfolios aren’t the only ones affected by HELOC end of draw. Non-HELOC lenders also are at risk when consumers are faced with payment shock. Experian analysis shows that it is an issue of consumer liquidity — consumers who reach HELOC end of draw are more likely to become delinquent not only on their HELOC, but on other types of debt as well. If consumers were 90 days past due on their HELOC at end of draw, there was a 112 percent, 48.5 percent and 24 percent increase in delinquency on their mortgage, auto and bankcard trade, respectively. With advanced data and analytics, lenders can be proactive in managing the risk associated with HELOC end of draw. Whether your customer has a HELOC with you or with another lender or is a new prospect, having the key data elements to obtain a full view of that consumer’s risk is vital in mitigating HELOC end-of-draw risk. Lenders should consider partnering with companies that can help them develop and deploy HELOC risk strategies in the near future. It is essential that lenders proactively plan and are well-positioned to protect their businesses from HELOC end-of-draw risk. Experian HELOC end of draw study

Increased volume of fraud attempts during back to school shopping season Back to school shopping season will be the first time many consumers' use their chip-enabled credit cards and stores' new card readers. With the average K-12 family spending $630.36 per child in back to school shopping, and more than 1/3 shopping online, according to the National Retail Federation - is your fraud strategy prepared to handle the increased volume? And are you using a dynamic knowledge based authentication (KBA) solution that incorporates a wide variety of questions categories as part of your multi-faceted risk based authentication approach to fraud account management? Binary verification, or risk segmentation based on a single pass/fail decision is like trying to stay dry in a summer rain storm by wearing a coat. It’s far more effective to wear rubber boots and a use an umbrella, in addition to wearing a rain coat. Binary verification can occur based on evaluating identity elements with two outcomes –pass or fail – which could leave you susceptible to a crafty fraudster. When we recommend a risk based authentication approach, we take a more holistic view of a consumers risk profile. We advocate using analytics and weighting many factors, including identity elements, device intelligence and a robust knowledge-based authentication solution that work in concert to provide overall risk based decision. After all, the end-goal is to enable the good consumers to continue forward based, while preventing the fraudster from compromising your customer’s identity and infiltrating you’re your business.

Protecting consumers from fraud this summer vacation It’s that time of year again – when people all over the U.S. take time away from life’s daily chores and embark upon that much-needed refresh: vacation! But just as fraud activity spikes during the holidays, evidence shows fraudster activity also surges during the summer, as the fraudster’s busy season is when we step away for some well-deserved rest and relaxation. With consumers on vacation, identity theft becomes easier. We all know someone who has been the victim of identity theft, resulting in fraudulent purchases on their credit card, or their bank accounts being emptied. Consumers are most likely to break from their normal spending habits, and credit card’s fraud analytics teams struggle to differentiate these changes in spending behavior for a family on vacation from a fraudster who has compromised dad’s identity. To make matter seven more challenging, consumers are less likely to take measures that will help minimize fraud while they are out of town, making the fraudster’s job easier. Identifying risky behaviors, or patterns outside of a consumer’s normal behavior when used in combination with a knowledge-based authentication session can help validate that the individual is indeed who they claim to be. A knowledge-based authentication solution with a wide variety of question types to complicate the fraudsters ability to pass should be part of a risk-based approach to on-going account management, especially when combined with a risk score and device intelligence. Take measures to incorporate a knowledge-based authentication solution with a diverse range of question types to help protect your business and your customers from being burned while on vacation, at least by fraudsters. For more on travel spending behavior and projections for summer 2015, click here.

I have heard from a few creditors that when it comes to allocating accounts to collection agencies for recoveries creating a rule based strategy isn’t always in the cards. When clients use multiple collection agencies their ability to allocate accounts to the different agencies based on rule based strategies isn’t always available. Some have a single setting on a billing or assignment system that indicates the account is to be assigned to Collection Agency X versus Collection Agency Y, and there is no easy method to make that assignment based on a true strategy. Worse yet, it is often difficult to impossible to reassign that account from Collection Agency X to Collection Agency Y if the account status or risk level changes. This means that their use of multiple collection agencies is not as “optimized” as it could be if a scripting or rule based tool was available to the business user. Optimizing assignments means that the account is initially as well as subsequently assigned to the right agency at the right time based on its type, risk, history, balance, status and other circumstances to maximum recoveries. This approach can make a significant difference in the recovery of bad debt. Furthermore, test results or allocations should be displayed after a script has been entered. This usually provides a “what if” on collection agency assignments displaying the number or dollar value assigned if the rule was implemented. That way you know if the script is correct (ballpark allocation seems reasonable), and if the allocation to any particular agency is within policy limits by dollar amount or number of accounts. Do you believe that you are optimizating your allocations to the agencies you use? Do you have the tools you need to effectively assign each account to the right agency? Experian can help with its agency allocation and management solutions through Tallyman Agency Allocation. Learn more about our Tallyman Agency Allocation software.