
When it comes to new vehicle registration, there is one segment that stands out from the pack: crossover vehicles.
According to Experian’s Q4 2018 Automotive Market Trends Analysis, over the last four years, crossovers (CUVs) have spiked in popularity, representing about a third of new vehicle registrations in 2014 (34.1 percent), but growing to nearly half the new vehicle market in 2018 (47.6 percent).
In fact, the large growth in CUVs isn’t limited to just the last four years – there was a large volume of growth year-over-year compared to 2017; the share has grown nearly 4 percent.
Sedans and hatchbacks, meanwhile, have seen their share decrease year-over-year. The charts below detail this change in market, based on Experian’s latest 2018 quarterly findings.
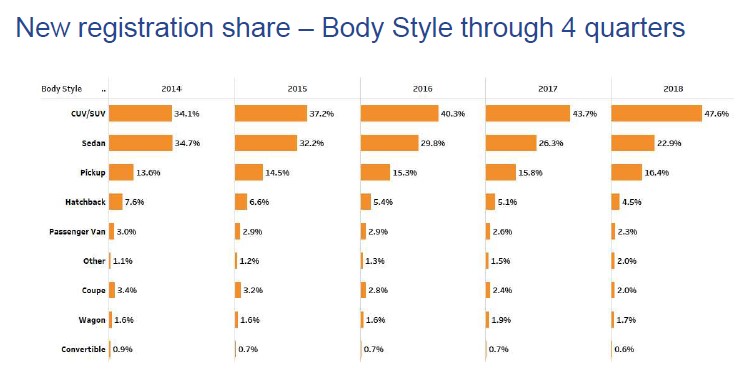 Source: Experian Automotive VIO as of December 31, 2018 (light duty registered vehicles only)
What’s driving this growth?
Across the board, the number of light-duty vehicles on the road continues to increase, up to 275.3 million in the U.S. market, at the end of 2018, compared to 271.4 million a year prior.
The growth in CUVs isn’t entirely unprecedented, as it’s been going on for a number of years. CUVs continue to grow in popularity for a variety of reasons including:
- Greater visibility, as the driver sits higher than in a sedan/coupe
- Larger storage capacities for passengers or cargo
- Number of varieties available, such as size, engines, and manufactures
- Higher fuel efficiency than a full-size SUV or minivan
Currently, there are over 130 different CUV/SUV Make/Model combos offered, and of those, the different engines, options, etc. drive that volume even higher.
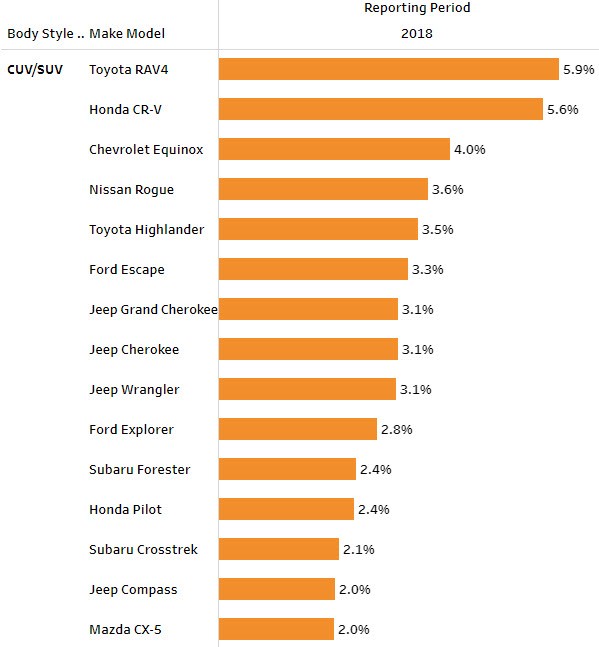 Source: Experian Automotive VIO as of December 31, 2018 (light duty registered vehicles only)
Potential for growth
Currently, there are only two CUVs among the top vehicles in the aftermarket “sweet spot.” Vehicles in the sweet spot are 6 to 12 model years old, and typically aged out of general OEM warranties for any repairs. These vehicles likely require more part replacement services, which may be performed by aftermarket service shops using parts from aftermarket part manufacturers.
According to Experian data, the sweet spot has stopped falling and has settled for now. But, there is expected growth of the number of vehicles that fall into the sweet spot over the coming years. One of the segments where the aftermarket industry can begin to focus on will be CUVs.
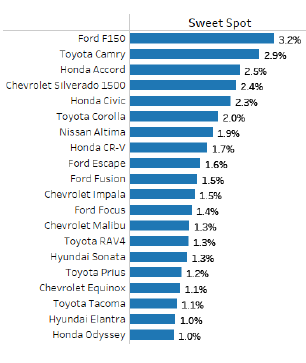
Source: Experian Automotive VIO as of December 31, 2018 (light duty registered vehicles only)
The aftermarket can use this data to make more informed product decisions, specifically, around the high volume of CUVs expected to come into the sweet spot.
With the number of vehicle options available on the market today, CUVs will continue to stand out as a segment to watch within the auto industry. There’s a greater story beyond the numbers and understanding how to leverage the data at hand can provide the industry with a greater understanding of CUVs and its potential for even greater growth.
To learn more about CUVs/SUVs and total vehicles in operation, view the full Q4 2018 Automotive Market Trends Analysis.