How to Be a Data-Driven Dealer

by James Maguire 5 min read May 30, 2018

The auto industry is blessed with an abundance of data – market research, demand estimates, demographic trends, registration history, not to mention your dealership’s own sales and inventory data. Dealers are often visual people – who love beautiful cars more than boring spreadsheets. The more visual you can make your data, the easier it will be to make decisions based on what it’s telling you. Here are the five steps to being a data-driven dealer.

1. Where am I selling the most cars?

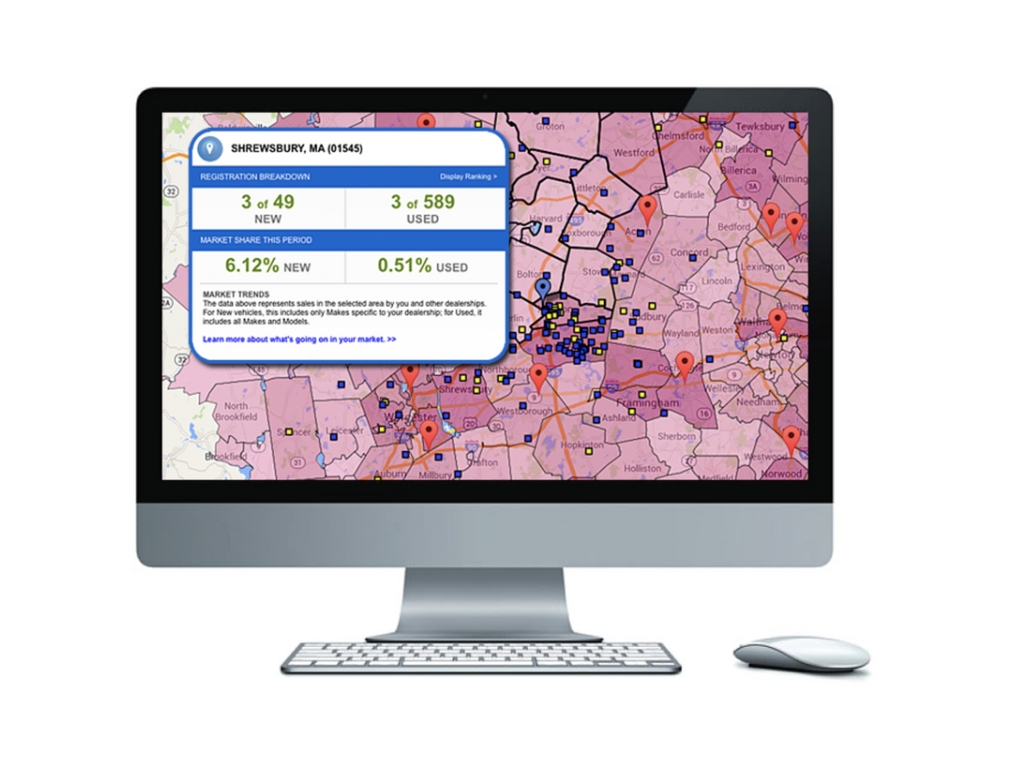
You probably have a good instinct about where the “hot spots” are around your dealership. But there’s a reason many dealers often display a map somewhere in the dealership, with pushpins representing recent new and used sales. It’s a tried-and-true technique because there’s no substitute for a visual representation of data, especially to get a good sense of where you’re currently successful.

More importantly, it will also help you answer a critical question – where should I be selling the most cars? By layering your web stats, such as Google Analytics, on top of your sales data, you can start to see whether your PPC spend is resulting in sales.

Then layer on registration data to understand whether you’re maximizing opportunity in your own backyard. You might already be selling a lot of cars into a town, but looking at your on-brand market share will help you determine if you’ve fully penetrated the area. Looking at overall market activity, not just your own data, is required to understand where you fit into the bigger picture and decide upon your best sales strategy.

2. Where should we be conquesting?

Once you’ve confirmed that you’re (hopefully) dominating in your town and those directly adjacent to you, it’s time to turn your eye to how to take on competitive dealerships farther afield. Again, data can help you determine next steps and target your budget appropriately.

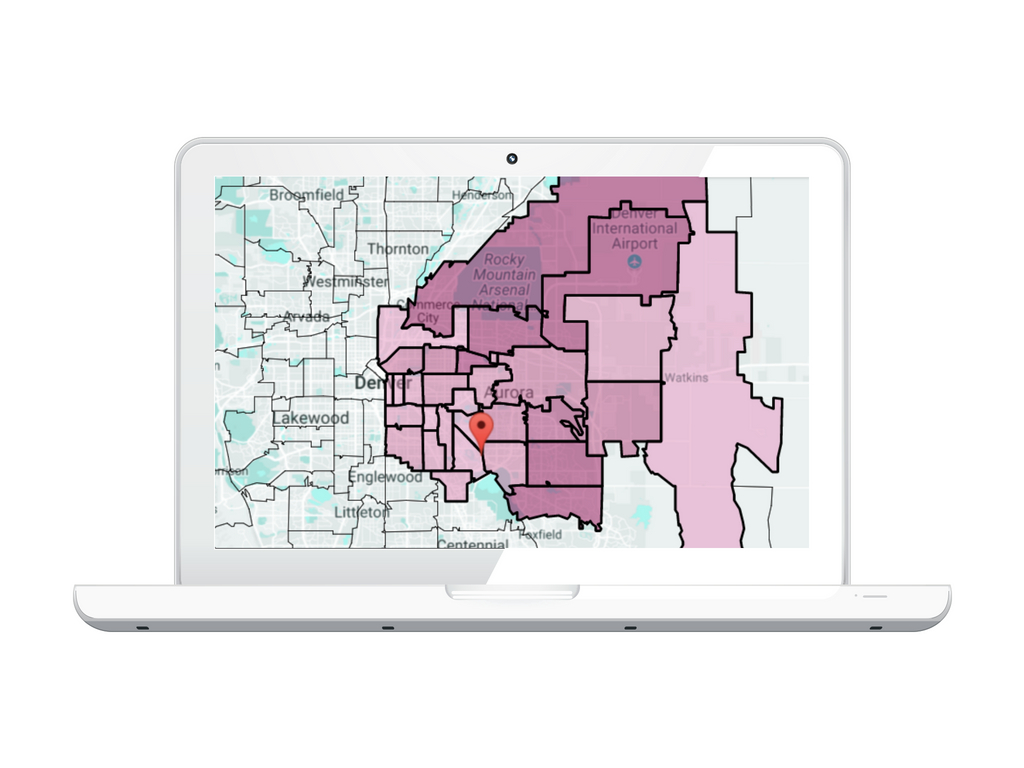
Every dealership approaches and defines “conquesting” a little differently, but there are two common techniques that can be made much easier using recent registration statistics.

First, look for ZIP Codes outside of your immediate PMA that are selling a high number of on-brand vehicles. These are your competitors’ happiest hunting grounds; focus on enticing shoppers in those areas to drive a little further to take advantage of special pricing or promotions, rather than attacking blindly in a 20-mile radius.

3. What is my best performing campaign now?

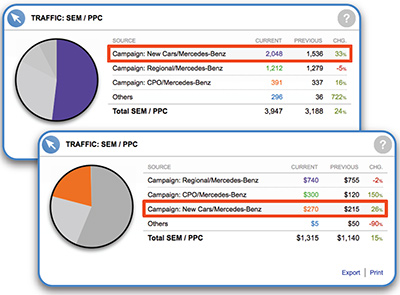
No matter what your position is at the dealership, you need to know what’s working best at any given moment. The GM needs to be able to make on-the-fly budgeting decisions, while the e-commerce Director wants to know which campaigns are working and what to do more of. But too often, the only objective measures we’re regularly provided are traffic stats. Traffic is important, of course, but we’d suggest there are three factors dealers should evaluate for every campaign.

A campaign may be driving lots of shoppers to your site, but if they’re immediately leaving the site, they aren’t worth much for you. A high bounce rate is your first sign that something is amiss since shoppers aren’t finding what they were looking for on your site.

A second-level analysis involves looking at what other pages visitors looked at after hitting the campaign landing page. For an offer focused on a specific vehicle, visitors should be moving on to look at inventory on VDP pages. Free oil change promotion? Visitors should be spending time on the service portion of your site. Work with your agency or internal e-commerce team to determine what content, language and images are the most effective at engaging potential buyers to take the desired action.

Speaking of action, conversion rate is your single best measure of whether a campaign is performing to expectations. Just make sure you’re measuring actions that matter: Form submissions, email leads, mobile clicks to call, and visits to hours and directions pages all indicate various levels of positive customer interest in beginning a dialogue.

4. How do I determine whether my traditional advertising spend is producing results?

Measuring dealer marketing ROI can be challenging, especially for traditional advertising. History tells us that radio, TV, newspaper, and outdoor are successful in driving demand, but quantifying that effect can be an elusive goal.

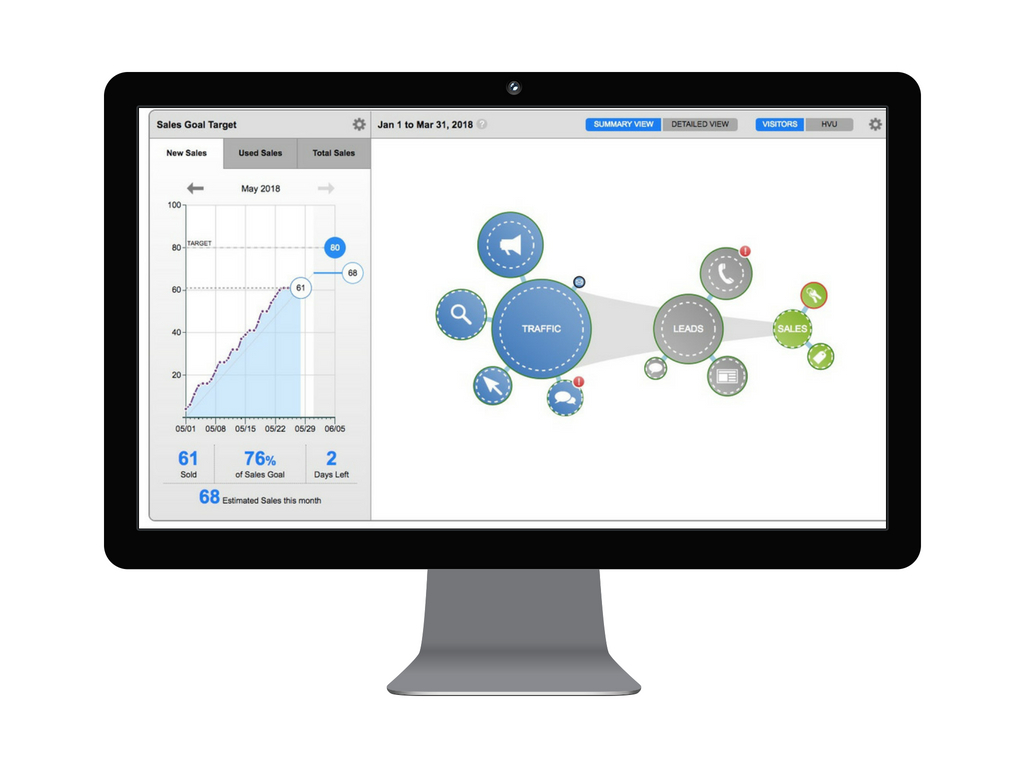
But there are methods that will get you closer to determine the effect of your traditional efforts on sales. By tagging the start dates of all your marketing activities and mapping them on a trendline of your traffic for your URLs, leads such as phone calls, chat, and coupon codes for your service department as well as sales, you’ll get a good sense about whether your offline campaigns are generating online interest.

5. Who is my ideal customer?

Once you understand which models are likely to move next month, your next question should be: “Who am I selling to?” You probably have a good sense of your typical customer profile for many models (there’s a good chance you’re showing minivans and SUVs to young families, for example). But do you know where those customers live? And how to best talk to them?

There is an incredible amount of data available on consumers, from credit history to buying behavior to lifestyle preferences. So how do you make use of this rich consumer data? At a basic level, Experian data can tell you a lot about the residents of each ZIP Code surrounding your dealership – from average age, income, and number of children, all the way to the most prevalent Mosaic® profiles in each town.  In a previous article, we talk about locating your ideal customer using Mosaic profiles. You might have a high number of “American Royalty” in one area, or an abundance of “Sports Utility Families” just a couple of towns over.

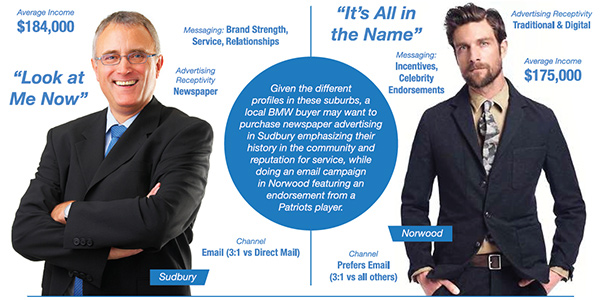
This information can tell you not only where you might want to market particular models, but what medium and messaging will resonate best in each area. While only 15 miles apart, the Boston suburbs of Sudbury and Norwood are home to very different types of BMW buyers, suggesting vastly different marketing campaigns to best appeal to each.

Data is a necessary tool for understanding your ideal customer, improving your marketing results, and selling more vehicles. These five steps to becoming a data-driven dealer address all your requirements to enrich your marketing and conquest more successfully.

Related Posts

How Consumer Vehicle Choices Are Shaping Automotive Loan Trends

Conversations about rising auto loan balances and higher monthly payments has often centered around increasing vehicle prices and elevated interest rates; and while those factors have undoubtedly played a role, another important piece of the puzzle is the type of vehicles consumers are choosing to purchase. According to Experian’s Automotive Consumer Trends Report: Q1 2026, consumers are continuing to opt for SUVs over other vehicle types, a trend that may be contributing to higher average loan amounts and monthly payments. SUVs accounted for 63.5% of all new retail vehicle registrations over the last 12 months, up from 62.8% a year ago. Additionally, more than 117 million SUVs were in operation across the United States in the first quarter of 2026, making up 42.2% of the market share. At the same time, traditional passenger cars continue to fall in share, coming in at 16.5%, a decrease from 18.4% last year. As consumers increasingly gravitate towards the larger vehicle segment, it reflects the ongoing desire for versatility, cargo capacity, and family-friendly functionality. Electrification’s growing role in consumer purchasing behavior Interestingly, electrified SUVs continue to gain traction, representing 27.7% of all new SUV registrations, these vehicles include battery-electric, hybrids, plug-in hybrids, and other alternative fuel types. Diving a bit deeper, the Tesla Model Y was the market share leader for new, retail electrified SUV registrations in the last 12 months, coming in at 15.8%. Rounding out the top five were Honda CR-V (9.6%), Toyota RAV4 (7.2%), Chevrolet Trax (7.2%), and Toyota Grand Highlander (3.4%). As model availability and familiarity with the electrification segment grows, the broader adoption of these vehicles are playing an increasingly important role in vehicle pricing and overall consumer demand. While average loan amounts and monthly payments are being driven by a combination of factors such as financing costs and consumer purchasing behavior, data in Q1 2026 demonstrates the continued interest in SUVs. This suggests that the industry’s shift toward larger vehicles is likely playing a meaningful role in today’s financing environment. To learn more about SUV insights, view the full Automotive Consumer Trends Report: Q1 2026 presentation.

Published: June 17, 2026 by Kirsten Von Busch
When New Data Impacts MBS Pricing: Student Loan Debt

In our previous post, we described the Current Second Lien Balance field, which is one of over 2,000 fields in the new Experian Mortgage Loan Performance (MLP) dataset. We showed that the Current Second Lien Balance field meets our three-pronged materiality standard for new data delivery: New: Provides information not available in existing datasets (i.e., orthogonal to currently available data). Material: Impacts a sizeable portion of the MBS universe. Significant: Differentiates collateral performance by a large enough margin to influence trading and risk management decisions. In this article, we discuss another field that satisfies the above criteria: Student Loan Balance.  We evaluate this field in the context of these criteria. First, however, we provide a summary of the MLP dataset and how it compares to standard GSE loan-level data available today. Standard GSE Data vs. Experian Mortgage Loan Performance (MLP) Data The MLP dataset contains thousands of fields describing mortgage performance from each borrower, loan, and property perspective, all refreshed monthly (including, amongst other things, new credit scores and refinance inquiry activity, loan performance, filed junior liens, and AVM values).  MLP differs from loan-level data provided byFreddie Mac, Fannie Mae, and Ginnie Mae, which the vast majority of market participants solely rely on, in a number of ways: Standard data provided by the GSEs and GNMA does not contain all the information necessary for accurate forecasting of mortgage prepayment and credit performance. Basic, critical fields like borrower’s current credit score and current junior liens on the property are missing. The new Mortgage Loan Performance (MLP) dataset from Experian contains borrower, loan, and property data fields covering the entire mortgage universe, including Agency, Non-Agency, and Esoteric mortgage products (CES, HELOC, Reverse), both securitized and non-securitized. MLP enables full three-dimensional (borrower + loan + property) tracking with persistent keys for borrower (before and after refinancing), loan (in securities/deals even after exit due to payoffs or buyouts, including before and after MSR sales), and property.  This enables end-to-end analysis of each borrower’s (and property’s) mortgage experience throughout their credit lifecycle. New, Material and Significant Field:  Student Loan Debt MLP contains a number of fields describing each mortgage borrower’s student debt load, including amounts in repayment, forbearance and collections; estimated interest rate, time remaining until forbearance expiration, and more. In the interest of simplicity, for this article we’ll focus on a single student loan-related field within MLP: Student Loans Balance, which is defined as the total balance on open non-deferred student trades reported in the last 3 months. Is Information Regarding Student Loans New to Markets? Standard loan-level data disclosed by the GSEs and GNMA contain no student-loan-specific fields. Theoretically, fields related to DTI at origination might capture some aspect of student loan debt. So, in the best case scenario for an investor relying solely on standard disclosure, a DTI value as of origination is provided -- yet is never updated as the loan seasons and the borrower’s debt and income change (see more here).  But in the case of federal student loan debt attached to mortgages originated from early 2020 to late 2023, the level of detail provided by disclosure may be even more unknown due to COVID-era repayment and reporting moratoriums. The student loan repayment moratorium was a temporary federal policy that paused required payments, set interest rates to 0%, and suspended collections on most federally-held student loans. The moratorium began in March 2020, with payments resuming in October 2023, making it approximately 3.5 years in duration—the longest consumer credit payment pause in U.S. history. (Source: NCUA ) During the moratorium, student loan-related debt loads may have been understated as federal loans were in a temporary state of $0 repayment.  As an alternative to leaving student loan debt completely out of DTI calculations, an imputed payment equal to only 0.50% of the outstanding balance was often used as a placeholder for a borrower’s DTI calculation. As a result, mortgages originated during the moratorium may have artificially low reported DTIs for borrowers with student loan debt, materially understating true post-moratorium debt .  Accordingly, prepayment risk for these loans is likely overstated in mainstream market models. Standard data only reports information related to the primary mortgage and does not include any details on the borrower’s other debts with the exception of DTI at origination, which is never updated throughout the life of the loan. In contrast, MLP provides a comprehensive view of the borrower’s full credit profile, including other obligations such as credit cards, mortgages on other properties, student loan balances, and much more. Is Student Loan debt material to the residential mortgage market? Approximately $11 trillion of residential mortgage loans were originated during the student loan payment moratorium (Source: Experian MLP Dataset), a period marked by historically low mortgage rates during the COVID era.  As discussed above, DTI data contained in standard market disclosure may be particularly inaccurate for these loans. As the Wall Street Journal recently reported, a new report from the Federal Reserve of New York shows a rise in student loan default rates by age group.  Student l Of today’s $13 trillion in outstanding mortgage debt, more than 10% of that debt ($1.5 trillion) is associated with borrowers who carry student loan debt.  For these borrowers, the average amount of student loan debt outstanding is approximately $50,000, versus a mortgage balance of approximately ~$289,000. In other words, the average student loan debt balance is almost 20% of the mortgage balance for the average borrower who carries both. For this set of borrowers, the average monthly payment is approximately $400 for student loan vs. approximately $2,200 for 1st lien mortgage—so that monthly student loan payments are a significant debt load, approximately 20% of the monthly mortgage payment.  (Source:  Experian MLP Dataset) Is the effect of student loan debt a significant driver of performance? Figure 1 illustrates prepayments by student loan balance for a sample of loans drawn from MLP. The chart illustrates that borrowers with larger student loan balances prepay much more slowly, likely because some are effectively locked out of refinancing once student loan payments resume due to elevated DTI. The debt-to-income (DTI) ratio calculated using actual student loan payments may be significantly higher than the DTI calculated during the moratorium, in some cases exceeding GSE eligibility thresholds. As illustrated in Figure 1, for in-the-money (ITM) collateral, the differential between loans with material student loan balances (greater than $200,000) and loans with no student debt can reach up to 5 CPR. Notably, even for out-of-the-money (OTM) collateral, loans with student debt prepay 1 to 3 CPR slower, likely reflecting reduced mobility due to tighter financing constraints when purchasing a new home. Pools with otherwise similar prepayment characteristics may exhibit different prepayment behavior depending on the distribution of student loan exposure within their collateral. In addition, because loans with student debt tend to prepay more slowly, this effect increases over time due to burnout: loans without student debt prepay and exit the pools more quickly, leaving a higher concentration of slower-paying loans behind.  Given that 10% of the $13 trillion outstanding mortgage market is associated with borrowers who have student loans (Source:  Experian MLP dataset)—and that student loans have a meaningful impact on prepayments—many pools issued between March 2020 and October 2023 may be subject to this student loan debt CPR throttle, and therefore mispriced by investors relying exclusively on standard market data. Fig 1. Prepayment S-Curve: Student Loans Balance Source:  Experian MLP dataset hosted on IVolatility Data-Driven Platform   _____________________________________________________ Michael Pyatski advises MBS traders, portfolio managers, quants, risk managers, loan originators, and technology professionals on making informed, data-driven business decisions that drive revenue growth, enhance risk management, and reduce trading costs. With more than 15 years of experience as an Agency RMBS trader—including serving as Head of the Proprietary Trading Desk at BNP Paribas—Michael developed and successfully implemented relative-value, data-driven profitable trading strategies to capture market opportunities embedded in data but not fully priced by the market. His trading experience, combined with a Ph.D. in econometrics, led him to found the Data-Driven Portal (https://datadrivenportal.com/), a platform that provides advanced technology for MBS trading and risk management. The platform’s No-Model Data-Driven technology leverages big data, econometric analysis, and AI to help traders identify relative-value opportunities in RMBS markets and generate above-market, risk-adjusted returns. _____________________________________________________

Published: June 17, 2026 by Perry DeFelice
Empowering merchants to reduce first-party fraud and chargebacks

Reduce first-party fraud and chargebacks with data-driven strategies that help merchants prevent disputes, protect revenue and improve customer trust.

Published: June 15, 2026 by Charles Hunter

Subscribe to our Auto blog

Enter your name and email for the latest updates.

This site is protected by reCAPTCHA and the Google Privacy Policy and Terms of Service apply.