Double Dip in Home Prices? Not So Fast.

by Guest Contributor 9 min read June 29, 2011

By: John Straka

The U.S. housing market remains relatively weak, but it’s probably not as weak as you think. To what extent are home prices really falling again?

Differing Findings

Most recent media coverage of the “double dip in home prices” has centered on declines in the popular Case-Schiller price index; however, the data entering into this index is reported with a lag (the just released April index reflects data for February-April) and with some limitations.  CoreLogic publishes a more up-to-date index value that earlier this month showed a small increase, and more importantly, CoreLogic also produces an index that excludes distressed sales.  This non-distressed index has shown larger recent price increases, and it shows increases over the last 12 months in 20 states. Others basing their evidence on realtors’ listing data have concluded that there was some double dip last year, but prices have actually been rising now for several months (See Altos).  These disparate findings belie overly simplistic media coverage, and they stress that “the housing market” is not one single market, of course, but a wide distribution of differing outcomes in very many local neighborhood home markets across the nation. (For a pointed view of this, see Charron.)

Improved Data Sources

Experian is now working with the leading source of the most granular and timely home market analytics and information, from nationwide local market data, and the best automated valuation model (AVM) provider based on these and other data, Collateral Analytics. (Their AVM leads in accuracy and geographic coverage in most large lender and third party AVM tests). While acknowledging their popularity, value, and progress, Collateral Analytics President Dr. Michael Sklarz questions the traditional dominance of repeat-sales home price indexes (from Case-Shiller etc.). 

Repeat-sales data typically includes only around 20 to 30 percent of the total home sales taking place. Collateral Analytics instead studies the full market distribution of home sales and market data and uses their detailed data to construct hedonic price indexes that control for changing home characteristics.  This approach provides a similar “constant quality” claim as repeat-sales—without throwing away a high percentage of the market observations. Collateral Analytics indexes also cover over 16,000 zip codes, considerably more than others.

Regular vs. Distressed Property Sales

Nationwide, some well-known problem states, areas and neighborhoods continue to fare worse than most others in today’s environment, and this skewed national distribution of markets is not well described by overall averages. Indeed, on closer inspection, the recent media-touted gloomy picture of home prices that are “falling again” or that “continue to fall” is a distorted view for many local home markets, where prices have been rising a little or even more, or at least remaining flat or stable. 

Nationwide or MSA averages that include distressed-property sales (as Case-Shiller tends to do) can be misleading for most markets. The reason for this is that distressed-property sales, while given much prominence in recent years and lowering overall home-price averages, have affected but not dominated most local home markets. The reporting of continued heavy price discounts (twenty percent or significantly more) for distressed sales in most areas is a positive sign of market normality.  It typically takes a significantly large buildup of distressed property sales in a local area or neighborhood home market to pull down regular property sale prices to their level. 

For normal or regular home valuation, distressed sales are typically discounted due to their “fire sale” nature, “as is” sales, and property neglect or damage. This means that the non-distressed or regular home price trends are most relevant for most homes in most neighborhoods.

Several examples are shown below. As suggested in these price-per-living-area charts, regular (non-distressed) home-sale prices have fared considerably better in the housing downturn than the more widely reported overall indexes that combine regular and distressed sales(1).

Regular-Sale and Combined Home Prices in $ Per Square Foot of Living Area

and Distress Sales as a Pct of Total Sales

In Los Angeles, combined sale prices fell 46 percent peak-to-trough and are now 16 percent above the trough, while regular sale prices fell by considerably less, 33 percent, and are now 3 percent above the trough.   Distressed sales as a percent of total sales peaked at 52 percent in 2009:Q1, but then fell to a little under 30 percent by 2010:Q2, where it has largely remained (this improvement occurred before the general “robo-signer” process concerns slowed down industry foreclosures).  L.A. home prices per square foot have remained largely stable for the past two years, with some increase in distressed-sale prices in 2009. Market prices in this area most recently have tended to remain essentially flat—weak, but not declining anew, with some upward pressure from investors and bargain hunters (previously helped by tax credits before they expired). Double-Dip: No.

In Washington DC, single-family home prices per square foot have been in a saw- tooth seasonal pattern, with two drops of 15-20% followed by sizable rebounds in spring sales prices. The current combined regular & REO average price is 17 percent below its peak but 13 percent above its trough, while the regular-sale average price is just 12 percent below the peak and 10 percent above its trough. Distressed sales have been comparatively low, but rising slowly to a peak of a little over 20 percent in 2010, with some slight improvement recently to the high teens. Single-family prices in DC have remained comparatively strong; however, more of the homes in DC are actually condos, and condo prices have not been quite as strong, with the market data showing mixed signals but with the average price per square foot remaining essentially flat.  Double-Dip: No.

In the Miami area, the combined average home price per square foot fell by 48 percent peak to trough and is now just 1 percent above the 2009:Q2 trough. The regular-sale average price already experienced an earlier double-dip, falling by 32 percent to 2009:Q2, then stabilizing for a couple of quarters before falling another 9 percent relative to the peak; since 2010:Q3 this average has been choppy but basically flat, now 3 percent above that second trough. Prices in Miami have been among the weakest in large metro areas, but average prices have been largely flat for the past year, without any sharp new double dip. Distressed sales as a percent of the total peaked at 53 percent in 2009:Q1, but then fell to a little under 30 percent by 2010:Q2; since then there has been some return to a higher distress share, in the mid to upper 30s (but all of these figures are about 10 percentage points lower for condos).   New Double-Dip: No.

The Dallas area has seen some of the strongest prices in the nation. The combined price per square foot had an earlier peak and fell by 31 percent peak to trough, but it is now 33 percent above the trough. The regular-sale average price fell briefly by 22 percent peak to trough, but it has since risen by 32 percent from the 2009:Q1 trough to where it is now 3 percent above the peak. The increases have occurred in a saw-tooth seasonal pattern with spring prices the highest, but prices here have been largely rising considerably. Distress sales as a percent of the total peaked at 22 percent in 2009:Q1 but have largely fallen since and now stand at just 11 percent.   Double-Dip: No.

Here You Can See 47 More Examples of Where Double-Dips Are and Are Not:

»         Pacific West

»         Southwest

»         Mountain West

»         Midwest

»        Northeast

»         Mid Atlantic

»         Southeast 

To summarize this information and gain a little more insight into the general area conditions for most homes and individuals in the U.S., we can add up the number of homes and the total population across the counties examined.  To be sure, this information is not a rigorous random sample across homes, but I have tried to include and show the details of both stronger and weaker metro-area counties throughout the U.S. As shown in the tables below, the information used here has covered 51 metro-area counties, including a total population of over 15 million homes and nearly 75 million individuals(2).  These results may be regarded as suggestive of findings from a more thoroughgoing study.

Based on these reviews of the market price averages and other data, my assessment is that a little over half of the counties examined are not currently or recently experiencing a double-dip in home prices. Moreover, these counties, where home prices appear to be at least flat or relatively stronger, encompass almost two-thirds (65%) of the total affected U.S. population examined, and nearly three-fifths (58%) of the total properties covered by the data studied.

Conclusion

This is, on balance, good news. But there are remaining concerns. One is the continued high, or more recently rising, shares of distressed sales in many markets, and the “shadow inventory” of distressed sales now being held up in the current foreclosure pipeline. But it is also interesting to see that many of the reductions in the distressed-property shares of total sales in high-stress areas occurred before the foreclosure processing slowdowns. Another interesting observation is that most of the recent double-dips in prices have been relatively mild compared to the previous original peak-to-trough meltdown.

While, to be sure, there are plenty of reasons to remain uncertain and cautious about U.S. home prices, home markets in general do vary considerably, with significant elements of improvement and strength as well as the continuing weaknesses. Despite many reports today about “the beleaguered housing market,” there really is no such thing … not unless the report is referring to a very specific local market. 

There definitely are double dips in many areas, and reasons for continuing overall concern. But the best available evidence suggests that there are actually double-dip markets—most relatively moderately so, stable markets, and stronger markets, with markets affecting a majority of homes and individuals actually in the stable and stronger categories. 


Note: In a next installment, we’ll look at some more granular micro market data, to explore in greater depth the extensive variety of home-price outcomes and market conditions in weak pockets and strong pockets across various local areas and home markets. This will highlight the importance of having very good information, at sub-county and even sub-zip code levels, on local-neighborhood home markets.

Source of Home Price and Market Information: Collateral Analytics HomePriceTrends. I thank Michael Sklarz for providing the extensive information for this report and for comments, and I thank Stacy Schulman for assistance in this posting.

__________________

(1) Based on analysis by Collateral Analytics, price/living sq ft is a useful, simple “hedonic” measure which typically controls for around 70 percent or more of the changing characteristics in a housing stock and home sale mix. Patterns in home prices without dividing by the square footage are generally similar, but not always.
(2) The property inventory counts are from Collateral Analytics, while the population estimates are from the 2010 U.S. Census.

Related Posts

New Data Available for MBS Investors: Current Credit Score 

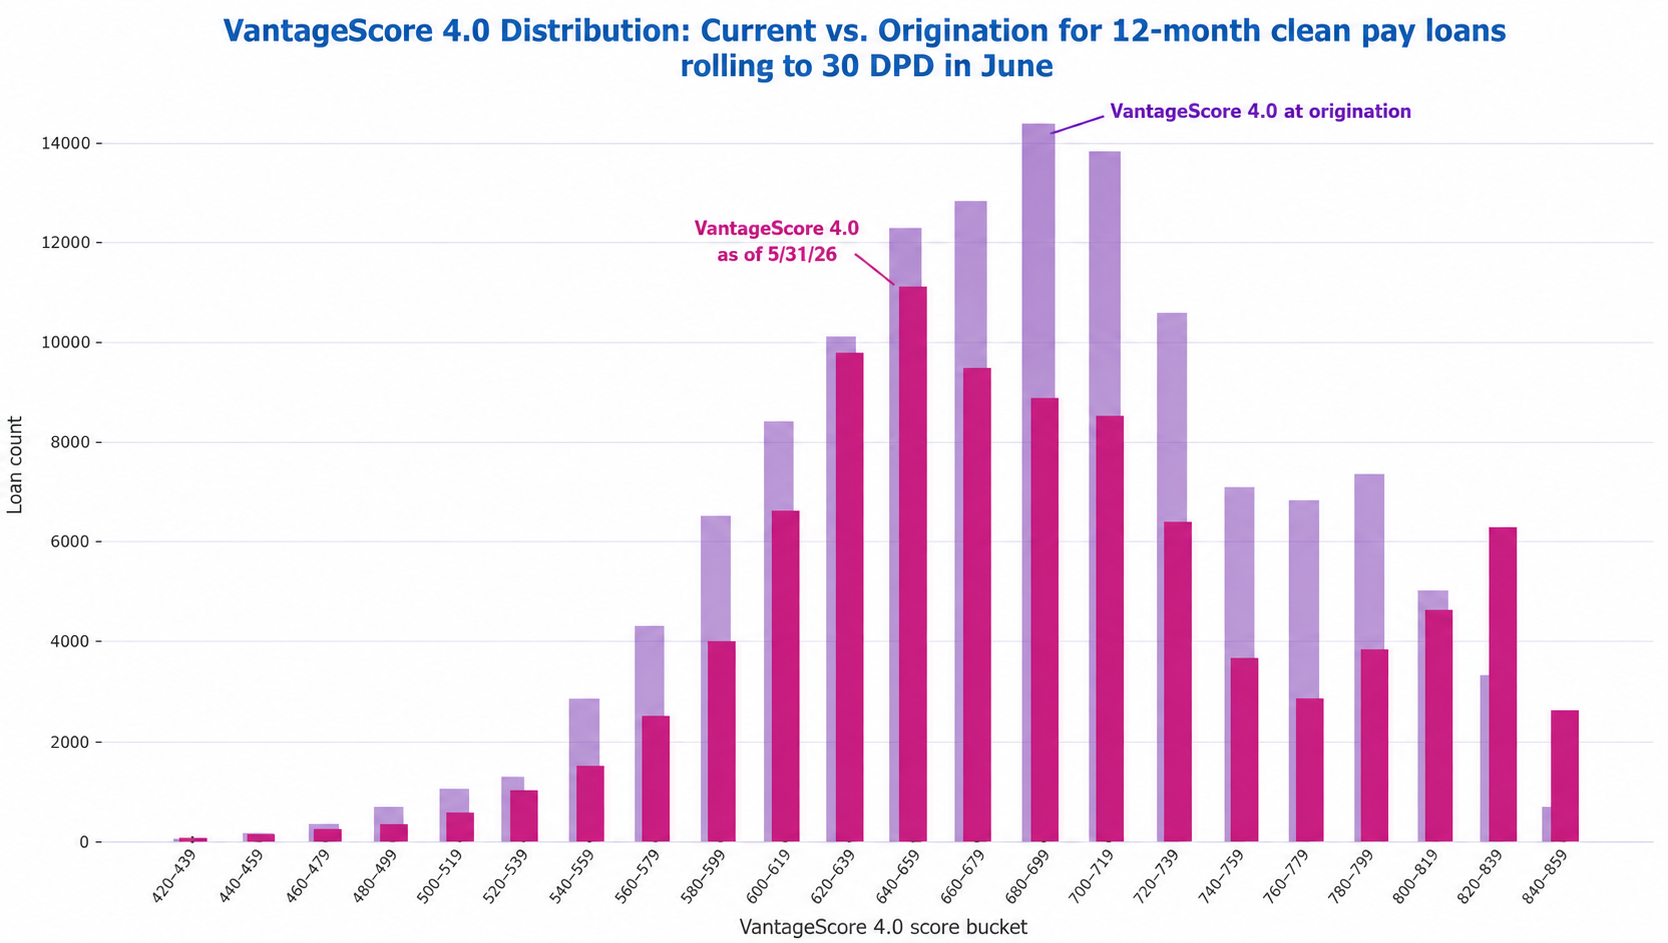
In a previous post, we described how every mortgage borrower’s financial situation and credit profile evolve over time.  After a borrower opens a loan, their financial status evolves—jobs are gained and lost; incomes can rise or fall, and financially stressful situations or windfalls can occur. These effects are often reflected in the consumer’s evolving credit score, which changes with the consumer’s payment behavior on open loans, credit inquiry activity, credit card utilization, and other revolving lines, among other things.    Even though MBS, whole loan, and MSR investors ultimately bear borrower credit risk, they may have access to less current borrower credit information than other participants in the mortgage ecosystem.   In securitized markets (both agency MBS and private-label MBS), updated scores are not provided in disclosure to bondholders, even as loans age year over year.  In whole loan and MSR markets, a single origination credit score is often provided at the time of bid, and after a successful bid, the investor may have a permissible purpose to pull individual scores on an owned portfolio. But until recently, there was no single loan-level dataset that included continuously refreshed credit scores across the U.S. mortgage market—the type of foundational dataset needed to build and tune credit and prepayment models.  A monthly-refreshed Current Credit Score field meets our three-pronged materiality standard for new data delivery to MBS markets:  New: Provides information not available in existing datasets (i.e., orthogonal to currently available data). Neither private-label MBS nor agency MBS standard market data includes a monthly-refreshed borrower credit score.  Material: Impacts a sizeable portion of the MBS universe. For the vast majority of loans in MBS, borrowers credit scores are available.  Significant: Differentiates collateral performance by a large enough margin to influence trading and risk management decisions.  A current credit score wraps all of a borrower’s credit-related behaviors into a single numerical value and has historically been associated with a borrower’s likelihood of becoming 60+ days past due on any obligation within the subsequent 24 months.    In fact, a current credit score is among the most informative indicators of near-term mortgage default risk, as shown in the image below, which depicts 30+ DPD rates by current credit score bands for the entire U.S. mortgage market, controlling for origination score <=650.    Without access to current credit scores, investors are limited to the score at origination—causing the four distinct performance trends shown here to appear as a single averaged line. In reality, score migration since origination reveals significant divergence in credit risk, with the lowest current-score bucket exhibiting a nearly 10 times higher 30+ DPD rate than the highest-score bucket in the latest period shown.  Source:  Experian Mortgage Loan Performance (MLP) dataset hosted on IVolatility DataDriven Platform  In this article, we’ll take a quick look at how score migration acts as an early predictor of a performing loan’s first roll into 30-day delinquent status.    MBS Investors’ Current Credit Score Blindspot: Solved   An MBS investor relying on standard market data and securitization remittance reports sees no sign of borrower stress until the subject mortgage loan in the securitization misses a payment and is reported at 30 days delinquent. Of course, in the vast majority of cases, a borrower begins struggling financially well before missing a mortgage payment:  The borrower may miss payments on other types of loans (credit card, auto loan, personal unsecured, or payday loans) as they prioritize their home and mortgage.  Outstanding balances on credit cards may grow as the borrower begins to make only minimum payments on revolvers.  The borrower may apply for additional credit cards, personal or payday loans   The borrower may apply to increase limits on existing credit cards as outstanding balance nears spending limit  All these stress-indicative behaviors result in a decreasing credit score, many months before the borrower misses their first mortgage payment. An MBS investor with access to each borrower’s current credit score, refreshed each month, can predict increased likelihood of default many months before the first missed mortgage payment—and is therefore at a major information advantage relative to the market generally.  Experian’s Mortgage Loan Performance (MLP) dataset contains thousands of fields describing mortgage performance from each borrower, loan, and property perspective, all refreshed monthly (including, amongst other things, new credit scores and refinance inquiry activity, loan performance on all types of debt, filed junior liens, and AVM values).   MLP is much more comprehensive than loan-level data provided by Freddie Mac, Fannie Mae, Ginnie Mae, and PLS data vendors in several ways:   Standard market datasets may not contain certain data elements that some market participants consider useful when evaluating mortgage prepayment or credit performance. Basic, critical fields such as the borrower’s current credit score and the current junior lien balance on the property are missing.    MLP contains borrower, loan, and property data fields spanning a broad portion of the mortgage universe, including Agency, Non-Agency, and Esoteric mortgage products (CES, HELOC, Reverse), including both securitized and non-securitized loans.   MLP enables full three-dimensional (borrower + loan + property) tracking with persistent keys for borrower (before and after refinancing), loan (in securities/deals even after exit due to payoffs or buyouts, including before and after MSR sales), and property.  This enables end-to-end analysis of each borrower’s (and property’s) mortgage experience throughout their credit lifecycle.  Is Downward-Trending Credit Score a Signal for Impending Delinquency?  MLP contains thousands of fields describing each loan, borrower, and property across all U.S. mortgages.  It allows for virtually unlimited segmentation and granular analysis.   For purposes of this illustrative article, we’ll take a high-level look at the entire U.S. mortgage market and perform a quick analysis to confirm intuition that a declining credit score provides a signal for higher likelihood of near-term mortgage delinquency.  Figure 1 illustrates the current pay status (as of 6/30) for the entire U.S. mortgage market, as contained in the MLP dataset, along with count, UPB and UPB-weighted Vantage 4.0 credit score for each bucket.  Figure 1  Source:  Experian Mortgage Loan Performance dataset  As illustrated in Figure 1, approximately 772,000 individual mortgage loans were reported to Experian as 30 days delinquent as of 6/30/2026.  Of the 772,000 30d delinquent loans in the June snapshot, approximately 426,000 were current in the prior (May) snapshot.  Some of these 426,000 loans were reperformers which had been bouncing from 30 DPD to current over the prior few snapshots. To remove reperformance score noise, we further parsed out the population which: 1) had rolled from current to 30 DPD from May to June; and 2) was consistently current for a full year prior to the 6/30 missed payment.  The population meeting both conditions totaled approximately 123,000 loans.  Figure 2 below shows, for this population of 123,000 “clean current” loans, the UPB-weighted average Vantage4 credit score for each of the 12 months leading up to the June missed payment, as well as the impact of the missed payment on the 6/30 score.  Figure 2  Source:  Experian Mortgage Loan Performance Dataset  Figure 2 reveals a rather slow and steady ~20-point deterioration of score in the 12 months prior to first missed payment – as well as the 80-point drop once the missed payment hits.  When we compare this cohort’s Vantage 4.0 score trend to the broader Current population across the entire dataset in Figure 3, we see a marked difference in both absolute value and trend:  Figure 3  Source:  Experian Mortgage Loan Performance Dataset  Not only is the cohort’s starting Vantage 4.0 score lower than the broader current population, but it also displays a dropping trend (with a notable 2 to 3x acceleration in monthly score drop the month before the first missed mortgage payment) while the broader Current population’s score (of which the isolated cohort is a subset) remains rock steady.  Lastly, we present Figure 4, a histogram comparing the distribution of at-origination and as-of 5/30 (i.e., the period just before the missed June mortgage payment) credit scores for the clean current population. The distribution appears to shift toward lower credit scores. To the extent credit scores are correlated with credit risk, this shift may indicate elevated credit risk relative to origination. Since this degradation occurs during a period of perfect mortgage pay performance, it is invisible to MBS investors who lack access to current borrower credit scores. Experian MLP provides monthly refreshed credit scores for mortgage borrowers contained within the MLP database.  Figure 4  Source:  Experian Mortgage Loan Performance Dataset 

September 22, 2026 by Michael Pyatski, Perry DeFelice
Ask the Expert: The Future of Lending Starts With Identity With Shawn Rife and Brian Cardona

Identity intelligence and alternative data can help lenders validate consumers and support more informed decisions across the customer lifecycle.

September 16, 2026 by Julie Lee
Financial Institutions Are Rethinking Customer Acqusition

Customer acquisition strategies are constantly evolving toward more precise targeting. From a marketing lens, you can track every step, optimize communication channels and still miss the person most likely to convert. Attribution can tell us which channels work and automation can make marketing spend more efficient. But both assume we know who is actually on the other end. Financial institutions are learning that finding audiences and targeting them is no longer the biggest challenge. As acquisition optimization marketing becomes more sophisticated, teams can measure and act on more signals than before. What they can't always know is whether the person on the receiving end is real. Customer acquisition has evolved into an identity problem. The challenge is not that every questionable signal represents malicious activity. It's that acquisition systems must make increasingly intelligent decisions with an imperfect understanding of who they're actually engaging. When identities are fragmented, duplicated, temporary or synthetic, optimization becomes a question of trust as much as targeting. When your signals don't reliably identify customers The customer journey often includes searching, filling out a form, creating an account, requesting a quote and subscribing. All of these signals work well when identity is relatively stable.  However, financial institutions are finding that these signals are becoming less reliable. A single person can operate across multiple personas, devices, browsers, aliases, accounts and intermediaries while several apparent “people” may actually represent one underlying actor. Financial instituions are finding: Fragmented customer signals Difficulty distinguishing an old account from a new one Different digital pathways associated with the same individual Signals that are generated by automation Real customers getting flagged because signals are too thin to evaluate confidently Legacy signals continue to be challenged Marketing has historically treated intent as a valuable signal because intent was relatively difficult to produce. A search required human intent. A form required someone to fill it out. An inquiry implied a meaningful amount of human effort. Financial institutions are already combating AI-enabled fraud, and now marketing teams are starting to face it on a massive scale. AI can mimic human behavior by researching products, comparing prices, filling out forms, creating accounts and signing up for services. A valid email address is no longer enough. Marketers need to know: How long has it existed? How recently has it been active? Does its activity appear consistent or suddenly anomalous? Has it gone dormant and returned? Is it associated with patterns that suggest stability or unusual behavior? How to build on your strongest signal Email remains one of the most persistent identifiers in digital commerce, following people across devices, platforms, transactions, subscriptions, accounts and years of activity. For over two decades, this has shaped how AtData thinks about identity. Now, as part of Experian, it’s shaping how an entire platform and team approach identity. A marketer doesn’t need every prospect to have existed online for twenty years. But understanding whether a newly acquired prospect has meaningful identity context can dramatically improve the quality of the decision being made around it. Better identity intelligence can help organizations reduce unnecessary friction by improving their ability to recognize legitimate customers. With a strong identity foundation, marketing teams can better address: Which audiences are more likely to convert? Which leads are high quality? Which channels are driving incremental growth? What do the best prospects look like? The value isn't simply having an email address. It's understanding the history and behavioral context associated with it. That context can provide a stronger digital identity signal, helping marketers understand how long they have been active, whether its behavior is consistent with that of a real person and whether current activity aligns with past patterns. It continues to be one of the most persistent identifiers in digital commerce. An infrastructure built for what's coming The acquisition of AtData by Experian reflects a fundamental shift in how identity infrastructure needs to work. Experian's scale and decisioning capabilities, combined with AtData's real-time email intelligence, create a strong platform. Read more about the why behind the acquisition and see how email works as an identity anchor for fraud prevention. Contact us to learn about our customer acquisition solutions

September 15, 2026 by Zohreen Ismail

Subscribe to our Newsletter

Enter your name and email for the latest updates.

This site is protected by reCAPTCHA and the Google Privacy Policy and Terms of Service apply.

Subscribe to our Newsletter

Don't miss out on the latest industry trends and insights!
Subscribe