Loading...

Electric and Hybrid Vehicle Financing Grows In Q4 2020

Published: March 4, 2021 by Melinda Zabritski

An electric vehicle charging

Alternative fuel vehicles aren’t a new concept, but they have certainly been gaining momentum in recent years, as manufacturers introduce new models and costs decrease.

What are the finance implications of the shifting marketplace for alternative fuels? In the Q4 2020 State of the Automotive Finance Market report, we zoomed in on the alternative fuel financing to get a better picture. Here are some of the trends we found.

Electric and hybrid vehicle financing is growing

Both electric and hybrid vehicles are growing their share of the finance market. In Q4 2016, electric and hybrid vehicles made up 2.99% of vehicle financing. It has more than doubled since then, making up 6.72% in Q4 2020.

Average monthly payments run higher for alternative fuel

For consumers looking for a new electric vehicle, they’ll likely be looking at a larger average monthly payment. In Q4 2020, the average monthly payment for an electric vehicle was $689.

Hybrid vehicles saw average monthly payments that aligned closer to those of gasoline vehicles. The average monthly payment for a gasoline vehicle in Q4 2020 was $524, and the average monthly payment for a hybrid vehicle was just $5 more, at $529.

Electric vehicles have the highest average credit scores for financing

Similar to what we’ve seen with average credit scores for new car loans, the average scores for new alternative fuel vehicles have mostly seen steady increases in the last few years. As of Q4 2020, the highest is for electric vehicles, at 763, followed by hybrid (756), and gasoline/flex (731).

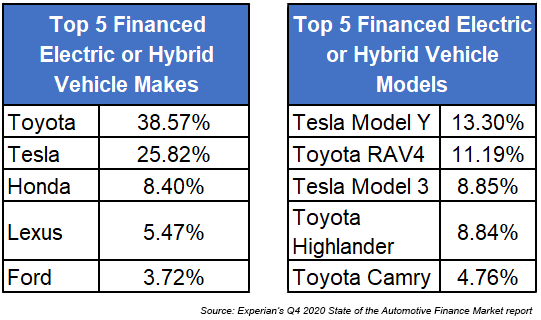
Toyota and Tesla are the most popular make and model

When looking at electric and hybrids, Toyota has the greatest market share at 38.5%, followed by Tesla at 25.82%. The most popular makes also go to these two brands: The Tesla Model Y was the most popular in Q4 2020 at 13.3%, followed by the Toyota RAV4 at 11.19%. Here’s how the top 5 round out for each category:

List of top 5 finances electric or hybrid makes and models

As manufacturers continue to introduce new electric and hybrid models, it is likely that the alternative fuel market will continue to grow in finance market share. By staying close to the data, lenders and dealers can make the most strategic decisions to navigate the ever-changing market in the years to come.

Learn more by watching Experian’s full Q4 2020 State of the Automotive Finance Market report

Related Posts

The electric vehicle (EV) market continues to see remarkable growth as both new and used registrations rise year-over-year. For the first time, new EVs accounted for 9.2% of all retail vehicle registrations across the U.S. in 2024, according to Experian’s 2024 EV Year in Review Report, and used EV registrations climbed to just over 1%, from 0.7% the year prior. As we dove into the data, we found that Tesla remains the dominant player in both new and used sectors; however, the shift in consumer preferences is extending across various manufacturers with more models hitting the market. For instance, Tesla accounted for 50.7% of new retail registrations in 2024, from 60.6% in 2023. Meanwhile, Ford increased from 4.7% to 6.2% year-over-year and Hyundai went from 4.2% to 5.4%. On the used side, Tesla made up 59% of retail registrations, from 60% in 2023, while Chevrolet grew from 7.1% to 9% and Nissan was at 5.4%, from 8.3%. As the EV market continues to grow, it’s not just the various manufacturers making waves; geographical trends are also coming into play in shaping how these vehicles are being embraced nationwide. While EV adoption is expanding well beyond the traditional EV strongholds, California still holds the highest number of registrations, with Los Angeles accounting for more than 180,000 new retail EV registrations, followed by San Francisco at 91,000+ and San Diego with more than 31,000. Hartford and New Haven, Connecticut experienced the highest growth in new retail EV registrations over the last five years, reaching 110.5% in 2024. Close behind were El Paso, Texas (with a 99% increase), and Colorado Springs, Colorado (with an 85.7% spike). These shifts highlight the rapid expansion of EV adoption across the country as we see more consumers in diverse areas opting for the fuel type. Analyzing and leveraging the broader range of registrations will help automotive professionals as they identify emerging markets to effectively tailor their strategies. To learn more about EV insights, visit Experian Automotive’s EV Resource Center.

Published: March 18, 2025 by Kirsten Von Busch

Quick Summary: Leasing continues to increase in the electric vehicle (EV) market. EVs accounted for nearly 20% of all new vehicle leases in Q4 2024, up from only 2.11% of new vehicle leases four years ago in Q4 2020. With consumers looking for flexibility—both in monthly payment and model availability—we’re seeing leasing continue to surge in the electric vehicle (EV) market. According to Experian’s State of the Automotive Finance Market Report: Q4 2024, EVs accounted for 19.5% of all new vehicle leases this quarter, up from 11.7% last year and a substantial increase from 2.1% in Q4 2020. Diving a bit deeper, data found EVs accounted for 9.3% of all new purchases in Q4 2024. Of those EVs, 50.1% were leased, while 38.9% were financed through loans. With lease payments for EVs ultimately being more affordable compared to loans and the excitement of driving the latest models packed with advanced technology, it’s no surprise we’re seeing leasing grow in popularity. Top leased EVs: How do lease and loan payments compare? As more consumers transition to EVs and manufacturers introduce new options to their lineup, certain models have become top choices for those opting to lease. Tesla accounted for the top two leased EVs in Q4 2024, with Tesla Model 3 coming in at 12.2% and Tesla Model Y at 9.1%. However, the Honda Prologue followed closely at 8.8% this quarter. Rounding out the top five were Hyundai IONIQ 5 (6.9%) and Chevrolet Equinox EV (5.9%). It’s notable that leasing has traditionally been a value-driven option for consumers, and the same holds true in the EV market. Leasing continues to offer lower monthly payments, making the finance option stand out for those looking to test an EV before purchasing or simply wanting the latest model on the lot. In Q4 2024, the average payment difference between a loan and a lease was $175. Though, the average monthly payment to lease a non-luxury EV was $504 this quarter, noting a $205 difference compared to the $709 loan payment. By comparison, the average monthly payment between a loan and leased luxury EV was $98—coming in at $842 for a lease and $940 for a loan. As more consumers choose to lease EVs, automotive professionals in both new and used markets have a chance to capitalize on this trend. By leveraging this data, those in the new retail market can effectively reach the right audience, while those in the used market can stay ahead of the curve and prepare for the influx of off-lease models in the coming years. To learn more about automotive finance trends, view the full State of the Automotive Finance Market: Q4 2024 presentation on demand.

Published: March 6, 2025 by Melinda Zabritski

The automotive industry is constantly changing. Shifting consumer demands and preferences, as well as dynamic economic factors, make the need for data-driven insights more important than ever. As we head into the National Automobile Dealers Association (NADA) Show this week, we wanted to explore some of the trends in the used vehicle market in our Special Report: State of the Automotive Finance Market Report. Packed with valuable insights and the latest trends, we’ll take a deep dive into the multi-faceted used vehicle market and better understand how consumers are financing used vehicles. 9+ model years grow Although late-model vehicles tend to represent much of the used vehicle finance market, we were surprised by the gradual growth of 9+ model year (MY) vehicles. In 2019, 9+MY vehicles accounted for 26.6% of the used vehicle sales. Since then, we’ve seen year-over-year growth, culminating with 9+MY vehicles making up a little more than 30% of used vehicle sales in 2024. Perhaps more interesting though, is who is financing these vehicles. Five years ago, prime and super prime borrowers represented 42.5% of 9+MY vehicles, however, in 2024, those consumers accounted for nearly 54% of 9+MY originations. Among the more popular 9+MY segments, CUVs and SUVs comprised 36.9% of sales in 2024, up from 35.2% in 2023, while cars went from 44.3% to 42.9% year-over-year and pickup trucks decreased from 15.9% to 15.6%. 2024 highlights by used vehicle age group To get a better sense of the overall used market, the segments were broken down into three age groups—9+MY, 4-8MY, and current +3MY—and to no surprise, the finance attributes vary widely. While we’ve seen the return of new vehicle inventory drive used vehicle values lower, it could be a sign that consumers are continuing to seek out affordable options that fit their lifestyle. In fact, the average loan amount for a 9+MY vehicle was $19,376 in 2024, compared to $24,198 for a vehicle between 4-8 years old and $32,381 for +3MY vehicle. Plus, more than 55% of 9+MY vehicles have monthly payments under $400. That’s not an insignificant number for people shopping with the monthly payment in mind. In 2024, the average monthly payment for a used vehicle that falls under current+3MY was $608. Meanwhile, 4-8MY vehicles came in at an average monthly payment of $498, and 9+MY vehicles had a $431 monthly payment. Taking a deeper dive into average loan amounts based on specific vehicle types—as of 2024, current +3MY cars came in at $28,721, followed by CUVs/SUVs ($31,589) and pickup trucks ($40,618). As for 4-8MY vehicles, cars came in with a loan amount of $22,013, CUVs/SUVs were at $23,133, and pickup trucks at $31,114. Used 9+MY cars had a loan amount of $19,506, CUVs/SUVs came in at $17,350, and pickup trucks at $22,369. With interest rates remaining top of mind for most consumers as we’ve seen them increase in recent years, understanding the growth from 2019-2024 can give a holistic picture of how the market has shifted over time. For instance, the average interest rate for a used current+3MY vehicle was 8.0% in 2019 and grew to 10.2% in 2024, the average rate for a 4-8MY vehicle went from 10.3% to 12.9%, and the average rate for a 9+MY vehicle increased from 11.4% to 13.8% in the same time frame. Looking ahead to the used vehicle market It’s important for automotive professionals to understand and leverage the data of the used market as it can provide valuable insights into trending consumer behavior and pricing patterns. While we don’t exactly know where the market will stand in a few years—adapting strategies based on historical data and anticipating shifts can help professionals better prepare for both challenges and opportunities in the future. As used vehicles remain a staple piece of the automotive industry, making informed decisions and optimizing inventory management will ensure agility as the market continues to shift. For more information, visit us at the Experian booth (#627) during the NADA Show in New Orleans from January 23-26.

Published: January 21, 2025 by Melinda Zabritski

Subscribe to our Auto blog

Enter your name and email for the latest updates.

This site is protected by reCAPTCHA and the Google Privacy Policy and Terms of Service apply.