Loading...

EVs Continue to Gain Momentum as Consumer Demand Intensifies

Published: February 14, 2023 by Melinda Zabritski

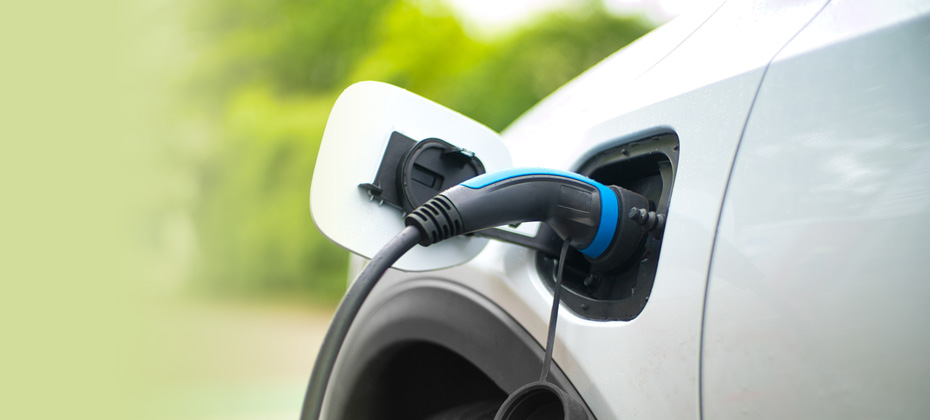
Electric vehicle charging

If there’s one thing this year’s NADA Show demonstrated, it’s that the industry is hyper-focused on electric vehicles (EVs). As new models are introduced to the market—with many more to come—and more states installing charging stations, it’s no surprise that EVs were top of mind.

To help the industry better understand the widespread growth, ahead of the show we compiled an Auto Finance Year-in-Review report to break down all things EV—from financing trends to vehicle segments and more.

In 2022, EVs comprised 5.32% of new vehicle financing, marking a notable increase compared to 3.09% in 2021, 1.69% in 2020, and 1.46% in 2019.

As EVs continue to build influence in the automotive industry, it’s important for professionals to understand trends that will enable them to plan for the future.

EV pricing is on the rise

Taking a deeper dive into the average price for both new and used EVs, the data continues to show the average loan amount is typically higher than other fuel types.

In 2022, the average loan amount for a new EV was $55,865, up from $48,190 in 2021. On the used side, the average loan amount increased from $41,482 to $53,367 year-over-year.

When comparing the average monthly payments between EVs and other fuel types—such as gasoline—there is a noteworthy difference. In 2022, the average monthly payment was $869 for a new EV and $792 for used. In comparison, the average monthly payment for a gasoline vehicle came in at $659 for new and $511 for used.

Banks lead in EV financing

While lenders navigate their way through the EV space, banks are currently leading in EV financing, despite other lenders such as credit unions offering longer terms for used EVs and lower interest rates for both new and used.

It’s important to note that banks comprised 27.32% of the total market share in vehicle financing in Q3 2022, just behind credit unions, who currently hold the largest share at 28.44%.

In 2022, credit unions offered notably lower rates for EVs, coming in at 3.49% for new and 4.48% for used. In comparison, banks offered 4.03% for new and 4.81% for used and captives were at 3.99% for new and 7.37% for used.

Though, banks had slightly longer terms for new EVs in 2022, credit unions had longer terms for used. Last year, banks gave consumers 68.65 months for new and 70.57 months for used and credit unions offered 68.61 months for new and 72.04 months for used. Meanwhile, captives had 64.91 months for new and 68.87 months for used.

While it’s no surprise credit unions are offering considerably lower rates and longer terms for used EVs—as they typically focus on the used vehicle space—it can be beneficial for all lenders to utilize this data in order to create more opportunities to gain additional market share as a whole.

As the EV market continues to grow, understanding the ongoing trends will enable automotive professionals to plan effectively and efficiently when assisting consumers in finding a vehicle that fits their lifestyle.

To learn more about current EV trends, view the full Auto Finance Year-in-Review presentation on demand.
Related Posts

While federal funding is being scaled back for community-based financial institutions, we are scaling up to support CDFIs and credit unions.

Published: March 28, 2025 by Corliss Hill

The electric vehicle (EV) market continues to see remarkable growth as both new and used registrations rise year-over-year. For the first time, new EVs accounted for 9.2% of all retail vehicle registrations across the U.S. in 2024, according to Experian’s 2024 EV Year in Review Report, and used EV registrations climbed to just over 1%, from 0.7% the year prior. As we dove into the data, we found that Tesla remains the dominant player in both new and used sectors; however, the shift in consumer preferences is extending across various manufacturers with more models hitting the market. For instance, Tesla accounted for 50.7% of new retail registrations in 2024, from 60.6% in 2023. Meanwhile, Ford increased from 4.7% to 6.2% year-over-year and Hyundai went from 4.2% to 5.4%. On the used side, Tesla made up 59% of retail registrations, from 60% in 2023, while Chevrolet grew from 7.1% to 9% and Nissan was at 5.4%, from 8.3%. As the EV market continues to grow, it’s not just the various manufacturers making waves; geographical trends are also coming into play in shaping how these vehicles are being embraced nationwide. While EV adoption is expanding well beyond the traditional EV strongholds, California still holds the highest number of registrations, with Los Angeles accounting for more than 180,000 new retail EV registrations, followed by San Francisco at 91,000+ and San Diego with more than 31,000. Hartford and New Haven, Connecticut experienced the highest growth in new retail EV registrations over the last five years, reaching 110.5% in 2024. Close behind were El Paso, Texas (with a 99% increase), and Colorado Springs, Colorado (with an 85.7% spike). These shifts highlight the rapid expansion of EV adoption across the country as we see more consumers in diverse areas opting for the fuel type. Analyzing and leveraging the broader range of registrations will help automotive professionals as they identify emerging markets to effectively tailor their strategies. To learn more about EV insights, visit Experian Automotive’s EV Resource Center.

Published: March 18, 2025 by Kirsten Von Busch

With the National Automobile Dealers Association (NADA) Show set to kickoff later this week, it seemed fitting to explore how the shifting dynamics of the used vehicle market might impact dealers and buyers over the coming year. Shedding light on some of the registration and finance trends, as well as purchasing behaviors, can help dealers and manufacturers stay ahead of the curve. And just like that, the Special Report: Automotive Consumer Trends Report was born. As I was sifting through the data, one of the trends that stood out to me was the neck-and-neck race between Millennials and Gen X for supremacy in the used vehicle market. Five years ago, in 2019, Millennials were responsible for 33.3% of used retail registrations, followed by Gen X (29.5%) and Baby Boomers (26.8%). Since then, Baby Boomers have gradually fallen off, and Gen X continues to close the already minuscule gap. Through October 2024, Millennials accounted for 31.6%, while Gen X accounted for 30.4%. But trends can turn on a dime if the last year offers any indication. Over the last rolling 12 months (October 2023-October 2024), Gen X (31.4%) accounted for the majority of used vehicle registrations compared to Millennials (30.9%). Of course, the data is still close, and what 2025 holds is anyone’s guess, but understanding even the smallest changes in market share and consumer purchasing behaviors can help dealers and manufacturers adapt and navigate the road ahead. Although there are similarities between Millennials and Gen X, there are drastic differences, including motivations and preferences. Dealers and manufacturers should engage them on a generational level. What are they buying? Some of the data might not come as a surprise but it’s a good reminder that consumers are in different phases of life, meaning priorities change. Over the last rolling 12 months, Millennials over-indexed on used vans, accounting for more than one-third of registrations. Meanwhile, Gen X over-indexed on used trucks, making up nearly one-third of registrations, and Gen Z over-indexed on cars (accounting for 17.1% of used car registrations compared to 14.6% of overall used vehicle registrations). This isn’t surprising. Many Millennials have young families and may need extra space and functionality, while Gen Xers might prefer the versatility of the pickup truck—the ability to use it for work and personal use. On the other hand, Gen Zers are still early in their careers and gravitate towards the affordability and efficiency of smaller cars. Interestingly, although used electric vehicles only make up a small portion of used retail registrations (less than 1%), Millennials made up nearly 40% over the last rolling 12 months, followed by Gen X (32.2%) and Baby Boomers (15.8%). The market at a bird’s eye view Pulling back a bit on the used vehicle landscape, over the last rolling 12 months, CUVs/SUVs (38.9%) and cars (36.6%) accounted for the majority of used retail registrations. And nearly nine-in-ten used registrations were non-luxury vehicles. What’s more, ICE vehicles made up 88.5% of used retail registrations over the same period, while alternative-fuel vehicles (not including BEVs) made up 10.7% and electric vehicles made up 0.8%. At the finance level, we’re seeing the market shift ever so slightly. Since the beginning of the pandemic, one of the constant narratives in the industry has been the rising cost of owning a vehicle, both new and used. And while the average loan amount for a used non-luxury vehicle has gone up over the past five years, we’re seeing a gradual decline since 2022. In 2019, the average loan amount was $22,636 and spiked $29,983 in 2022. In 2024, the average loan amount reached $28,895. Much of the decline in average loan amounts can be attributed to the resurgence of new vehicle inventory, which has resulted in lower used values. With new leasing climbing over the past several quarters, we may see more late-model used inventory hit the market in the next few years, which will most certainly impact used financing. The used market moving forward Relying on historical data and trends can help dealers and manufacturers prepare and navigate the road ahead. Used vehicles will always fit the need for shoppers looking for their next vehicle; understanding some market trends will help ensure dealers and manufacturers can be at the forefront of helping those shoppers. For more information on the Special Report: Automotive Consumer Trends Report, visit Experian booth #627 at the NADA Show in New Orleans, January 23-26.

Published: January 21, 2025 by Kirsten Von Busch

Subscribe to our Auto blog

Enter your name and email for the latest updates.

This site is protected by reCAPTCHA and the Google Privacy Policy and Terms of Service apply.