Tag: auto

Data driven insights about your marketplace are critical to your success. For instance, data can be used to determine if your customers are loyal or if they are likely to defect to another dealership. According to Experian research, there were 54 million consumer vehicle sales transactions in 2017. While that may sound great, not all returning buyers are loyal. In fact, we found that three out of four people are not dealer loyal. Even though only ¼ of a dealer’s customer base regularly return, the remaining ¾ can be conquested. 41 million non-dealer loyal vehicle sales happened in 2017, meaning there were 41 million chances to conquest for dealers across the country. You may be asking yourself “that’s interesting, but how do I win?”. Start with best in class data. At Experian, we work with our North American Vehicle Database℠, File One℠ Credit Database, and Consumer View℠ Marketing Database. These databases have information including the history of 900 million vehicles in the United States and Canada, 10 billion vehicle history records, to consumer data about credit inquiries and data attributes for consumers and households. Figuring out how to increase customer loyalty and conquesting becomes simple once you consider Experian’s solution: Auto HyperConnect™. Auto HyperConnect is the answer to the question of “how do I use my data to win my market?” Our Auto HyperConnect suite includes two different products. The first is Auto HyperMonitoring™ which improves customer loyalty. The second is Auto HyperTargeting™, which offers four different ways to conquest vehicle owners: through owners/service, expired leases, off-loan, and current vehicle equity. Since there is a lot to talk about regarding conquesting vehicle owners, this will be a basic overview and we will go into detail later. Experian goes beyond providing quality data to our clients- we are your partner in the discovery of critical information to drive your success. The first step in our Auto HyperTargeting methodology starts with discovery - working with an Experian Automotive representative to create the most effective conquest strategy. After that, quantify and understand what data is available and how similar records have performed historically. Next, execute the strategy by launching campaigns to communicate with prospective customers via direct mail, email, and phone, etc. Finally, measure and track results with quarterly marketing attribution reporting with Experian’s Auto Response Analysis With Auto HyperTargeting, these six product benefits help it to stand apart from the competition: Highly targeted audiences and attributes lists closely fit prospecting profiles. These profiles include geography, vehicle make, vehicle class, and lease maturity data. Append 1,500+ demographic attributes, 650+ psychographics, and 70+ Mosaic segments. Complete, accurate, and actionable data is delivered timely. Data derived from the source with proprietary processes ensure that it’s the highest quality and best coverage. Flexible marketing execution has no firm offer of credit required and customizable messaging for relevancy. Full visibility performance tracking has closed loop ARAs delivered quarterly with performance details. Performance driven audience hyper targeting approach gets dealers the closest to the customer as possible while saving time and money. Focusing on marketing strategy and tactics delivers results and eliminates waste from unproductive volume/cost opportunities. Finally, the competitive advantage takes market share away from the competition by identifying, engaging, and converting the right prospects. Briefly, here are the four different types of conquesting a dealer can do with Auto HyperTargeting: Expired Lease lets a dealer conquest new prospects based on customized input criteria including zip codes, vehicle makes and classes, and lease maturity data with the marketing flexibility necessary to drive engagement and win new customers. There is no firm offer of credit required. Vehicle Owners lets a dealer engage with current owners to enable new relationships and opportunities. These opportunities reach out to service and parts, aftermarket accessories, new/used car, warranty, insurance, and financial services. Vehicle Equity identifies, engages, and acquires new customers with positive vehicle equity status and maximizes sales opportunities. Getting consumers into a new vehicle, into re-finance solutions, into new loans, and get third party offers in front of consumers are all apart of vehicle equity. End of Loan connects dealers with consumers who are reaching the end of their loan term and help them transition into their new vehicle of choice. These include customized offers, getting consumers into a new vehicle, getting consumers into new loans, and getting third party offers in front of consumers. Juggling the requirements to both maintain customer loyalty and conquest for new ones can be difficult, but our Auto HyperConnect suite helps dealers to succeed at both. In our upcoming mini-series on conquesting with Auto HyperTargeting, we will detail it’s four core capabilities in more detail to help dealers to conquest with confidence.

Who is the ideal dealership customer? Wouldn’t they be one that buys or leases a car and becomes a repeat customer? Loyal customers are ideal because they prefer to go to your dealership to purchase a vehicle, get their vehicle serviced, and even have their family and friends purchase from you. This brings up an important question: what is customer loyalty worth to you? According to the White House Office of Consumer Affairs, on average, loyal customers are worth up to 10 times as much as their first purchase. They also found that it is six to seven times more expensive to acquire a new customer than it is to keep a current one. Marketing Metrics found the probability of selling to a new prospect is only between 5-20%. But if you are selling to an existing customer, the probability rises to 60-70%. So, knowing this, what holds dealers back from actively conquesting loyal customers? Time, money, resources, expertise, priority, process and systems, and data are the key factors that keep them from pursuing these ideal customers. Even though you may stare across the street at them every day, you must remember that your competition is much bigger than the dealerships next door to you. According to recent Experian® research, Whether it is a new, certified used, or non-certified used vehicle, auto manufacturers will have the highest level of loyalty by owned vehicle acquisition. Next to that, you have the Make of a vehicle followed the Model. Dealerships rank last in loyalty against these major factors. This leads to asking a few “what-ifs”. What if you have the unique opportunity to improve customer loyalty, make more money, and prevent defection to the competition? What if you had actionable insights to know your customer’s buying and loyalty propensities with a high degree of accuracy? How about if you had knowledge of timing on when to engage with your customers to appropriately deliver the right message and offers with the highest potential conversion rate? Finally, what if you had an easy, cost-effective, yet powerful way to unify big data relating to consumer, vehicle, and market and your customer data to make better marketing decisions? Thanks to Experian® and Auto HyperConnect™, you don’t have to ask those questions anymore. Auto HyperConnect leverages the most robust combination of data assets under one roof. Our loyalty component is called Auto HyperMonitoring™ and takes loyalty to the next level. Auto HyperMonitoring is an event-based customer loyalty measurement solution that gives you the ability to more effectively manage and strengthen your customer retention efforts. With insights derived from the monitoring of both macro- and micro-environments relating to the vehicle, consumer events, and the overall automotive landscape, clients can quickly gain a deep understanding of consumer loyalty propensities and can create and execute initiatives that maximize their customer loyalty opportunities. Starting with a client’s customer file, Auto HyperMonitoring provides data hygiene that verifies the VIN matches the customer household and will only monitor the VINS that have a match. Next, there is monitoring for vehicle events such as accidents or airbags going off. Consumer events equate to having a baby or moving. Market events involve incentives, OEM loyalty, and warranty expiration. Data events are phone numbers, email address, or VIN verification through the hygiene process.. These events feed into the creation of analysis & insights to identify your customers’ behavioral patterns attributed to loyalty, purchasing, and other factors. When key opportunities are identified, there is client notification. This is used to manage the customer relationship and loyalty through a dealer’s CRM system and comes in an email. How you would use Auto HyperMonitoring? It can be used to bring customers back into the showroom or service lanes in a few different ways. Initially, Dealers can call consumers to open the lines of communication. Next, sending consumers emails and direct mail with special offers are both effective. Finally, Auto HyperMonitoring can also be used to activate digital media targeting campaigns to better reach them where they’re spending their time. Finally, we have the product benefits of Auto HyperMonitoring. First off, it enhances customer engagement & loyalty. By proactively engaging with clients at the right moment based on important and relevant vehicle, customer, and market-related event triggers, loyalty can be systematically strengthened. Second, it improves marketing efficiency. Knowing when to engage with your customer base to minimizes the risk of over and under marketing exposure; improve conversion and reduce cost. Third, complete, accurate, & actionable data is delivered in a timely manner. Auto HyperMonitoring leverages both a client’s customer file and Experian’s rich data assets to enable a complete view of customer opportunities. Finally, Auto HyperMonitoring compliments and supports OEM/dealer loyalty programs. Maximizing revenue opportunities by achieving/surpassing OEM/Dealer loyalty program goals is possible with Auto HyperMonitoring. Customer loyalty is important and will directly impact dealership sales in both your showroom and your service lanes – including the benefit of referral customers. The challenges of competing with manufacturers and other dealerships are mitigated with Experian’s Auto HyperConnect suite and Auto HyperMonitoring. With these, you will have greater success when targeting customer loyalty and using data to keep the relationship between the dealership and the customer alive.

The auto industry is blessed with an abundance of data - market research, demand estimates, demographic trends, registration history, not to mention your dealership's own sales and inventory data. Dealers are often visual people - who love beautiful cars more than boring spreadsheets. The more visual you can make your data, the easier it will be to make decisions based on what it's telling you. Here are the five steps to being a data-driven dealer. 1. Where am I selling the most cars? You probably have a good instinct about where the "hot spots" are around your dealership. But there's a reason many dealers often display a map somewhere in the dealership, with pushpins representing recent new and used sales. It's a tried-and-true technique because there's no substitute for a visual representation of data, especially to get a good sense of where you're currently successful. More importantly, it will also help you answer a critical question - where should I be selling the most cars? By layering your web stats, such as Google Analytics, on top of your sales data, you can start to see whether your PPC spend is resulting in sales. Then layer on registration data to understand whether you're maximizing opportunity in your own backyard. You might already be selling a lot of cars into a town, but looking at your on-brand market share will help you determine if you've fully penetrated the area. Looking at overall market activity, not just your own data, is required to understand where you fit into the bigger picture and decide upon your best sales strategy. 2. Where should we be conquesting? Once you've confirmed that you're (hopefully) dominating in your town and those directly adjacent to you, it's time to turn your eye to how to take on competitive dealerships farther afield. Again, data can help you determine next steps and target your budget appropriately. Every dealership approaches and defines "conquesting" a little differently, but there are two common techniques that can be made much easier using recent registration statistics. First, look for ZIP Codes outside of your immediate PMA that are selling a high number of on-brand vehicles. These are your competitors' happiest hunting grounds; focus on enticing shoppers in those areas to drive a little further to take advantage of special pricing or promotions, rather than attacking blindly in a 20-mile radius. 3. What is my best performing campaign now? No matter what your position is at the dealership, you need to know what's working best at any given moment. The GM needs to be able to make on-the-fly budgeting decisions, while the e-commerce Director wants to know which campaigns are working and what to do more of. But too often, the only objective measures we're regularly provided are traffic stats. Traffic is important, of course, but we'd suggest there are three factors dealers should evaluate for every campaign. A campaign may be driving lots of shoppers to your site, but if they're immediately leaving the site, they aren't worth much for you. A high bounce rate is your first sign that something is amiss since shoppers aren’t finding what they were looking for on your site. A second-level analysis involves looking at what other pages visitors looked at after hitting the campaign landing page. For an offer focused on a specific vehicle, visitors should be moving on to look at inventory on VDP pages. Free oil change promotion? Visitors should be spending time on the service portion of your site. Work with your agency or internal e-commerce team to determine what content, language and images are the most effective at engaging potential buyers to take the desired action. Speaking of action, conversion rate is your single best measure of whether a campaign is performing to expectations. Just make sure you're measuring actions that matter: Form submissions, email leads, mobile clicks to call, and visits to hours and directions pages all indicate various levels of positive customer interest in beginning a dialogue. 4. How do I determine whether my traditional advertising spend is producing results? Measuring dealer marketing ROI can be challenging, especially for traditional advertising. History tells us that radio, TV, newspaper, and outdoor are successful in driving demand, but quantifying that effect can be an elusive goal. But there are methods that will get you closer to determine the effect of your traditional efforts on sales. By tagging the start dates of all your marketing activities and mapping them on a trendline of your traffic for your URLs, leads such as phone calls, chat, and coupon codes for your service department as well as sales, you'll get a good sense about whether your offline campaigns are generating online interest. 5. Who is my ideal customer? Once you understand which models are likely to move next month, your next question should be: "Who am I selling to?" You probably have a good sense of your typical customer profile for many models (there's a good chance you're showing minivans and SUVs to young families, for example). But do you know where those customers live? And how to best talk to them? There is an incredible amount of data available on consumers, from credit history to buying behavior to lifestyle preferences. So how do you make use of this rich consumer data? At a basic level, Experian data can tell you a lot about the residents of each ZIP Code surrounding your dealership - from average age, income, and number of children, all the way to the most prevalent Mosaic® profiles in each town. In a previous article, we talk about locating your ideal customer using Mosaic profiles. You might have a high number of "American Royalty" in one area, or an abundance of "Sports Utility Families" just a couple of towns over. This information can tell you not only where you might want to market particular models, but what medium and messaging will resonate best in each area. While only 15 miles apart, the Boston suburbs of Sudbury and Norwood are home to very different types of BMW buyers, suggesting vastly different marketing campaigns to best appeal to each. Data is a necessary tool for understanding your ideal customer, improving your marketing results, and selling more vehicles. These five steps to becoming a data-driven dealer address all your requirements to enrich your marketing and conquest more successfully.

When sales are going relatively well, do you immediately look to conquesting? Are your key vendors encouraging you to do so? There’s absolutely nothing wrong with being out to conquer the world. No matter how you define conquesting – stealing market share from your competitors on their turf, making inroads on a cross-shopped make, or expanding your sales radius – chances are, you shouldn’t be focused on doing it. At least not until you’ve created some high barriers to prevent competitors from encroaching into your territory. Luckily, it’s easy to know when to stop conquesting and start getting defensive. All you need to answer is one simple question: Do you own your backyard? Even when it feels like all is going well in terms of sales and market penetration, it’s worth taking another look. You might be doing lots of volume in your immediate vicinity, but still be missing out on a lot of potential sales that are going to your competitors. We suggest that most dealers shouldn’t be happy with anything less than 90% market share of new, on-make models in surrounding ZIP Codes™. If you’re not regularly tracking your “backyard” market share, it’s a good practice to get in. Here’s why you should care about totally shutting out the competition in your local area: You’ve got physical brand presence. Buyers in your ZIP code and the surrounding towns drive by your sign every day. Your name should be the first they that comes to mind when they think of your make. You should own hometown SEO. Do you own search terms like “Honda dealers in Lakeland”? If you’re not the number one organic search result for your town, you’ve got some work to do. These are your most likely service customers. Every local deal you walk away from is a potential – and profitable – service customer lost. If you don’t own your backyard, what should you do about it? Aside from making sure you’ve got your SEO and SEM in good shape, it may well be an inventory problem: Are you stocking the models that buyers in your area are looking for? Here’s where looking at data from outside your four walls can be helpful. Demand data which aggregates online search activity to determine what models shoppers are likely to be buying in the next six weeks – can be a great resource to determine what’s going to be hot. This can certainly assist you in acquiring in-demand used inventory, and while you don’t always have control over your new allocations, a grasp of local purchase trends can help you figure out where and how to successfully market the models you do have on your lot. You may find that one or two problem models are dragging down your total market share – either because you have a large volume of them in stock and they aren’t moving, or they are hot sellers and you don’t have enough of them to meet demand. Once you’ve got the basics covered and you’ve identified any inventory gaps, let’s get granular about your strategy to dominate market share. A great way to do that is to look at the models and zip codes where you’re losing market share, starting with your bread and butter models. Dig in and look at your market share, by ZIP code, for each of your high-volume models. If you’re well under that 90% threshold on Focuses or 3-series, for example, that’s a good place to start targeting your marketing efforts in your backyard. So how do you sell more cars into the Zip codes you’ve identified? By understanding the prospective buyers of your chosen model and laser-targeting your marketing to appeal to them. Demographic data from the likes of Experian Automotive can provide a rich array of details on the values and preferences of buyers who are most likely to be interested in your specific vehicles. From the advertising channels that reach them, to the types of offers and benefits they prefer to hear about, there’s a plethora of valuable information available to inform successful campaigns. Armed with this data, it’s possible to hone your messaging to appeal to those individual buyers, especially when undertaking campaigns that can be targeted down to the ZIP code level, such as PPC and direct mail. If you’re not already buying your PPC by ZIP code, and creating model-specific landing pages with customized messaging for each area, we highly recommend it for a dramatic effect on conversion. We’ve seen rates rise from 2% to 8%, and inventory engagement rates rise from 50 to 90%, just by employing these techniques. By employing your marketing dollars more strategically and creating messaging that better resonates with consumers, you’ll be well on your way to consistently achieving dominant market share in your own backyard. But once accomplished, the work is not done! Be sure to experiment with conquesting against competitive makes – and do so in a controlled and measurable way. Here are some considerations as you set your strategy: Choose just one make to take on… but avoid conventional wisdom. If you’re a Honda dealer, conventional wisdom says conquest Toyota – since they consistently show up in the list of cross-shopped makes for Honda, regardless of market. But Toyota buyers are highly loyal… how much are you going to have to spend to convince them to leave their tried and true models? Why not go after Kia or Hyundai instead? Stick with your bread and butter models. You might be all excited about that shipment of new electric vehicles you just got in stock, but those “specialty” buyers are going to seek you out. For the highest impact, spend your conquesting dollars where you’re doing the most volume. For example, , if you’re a BMW dealer, put your 3-series up against the Lexus IS. Choose 3-4 ZIP codes in your PMA where demand is highest. It may be tempting to try to lure buyers who are farther afield, but you are more likely to lose on the front and back end of every sale that’s over 20 miles from your dealership. Remember, we’re looking for buyers that are easy to lure and have a good shot at becoming loyal service customers These techniques can be used persistently to ensure that you own your backyard, dominate your PMA and steal market share from your competitors. All it takes is knowledge of your market. Your gut will lead you in the right direction most of the time, but look at the data to verify your instinct, and be open to being surprised. Take the time to wait for results before moving on to the next campaign. You’re guaranteed to learn something that will make you better next time. And there’s no need to go it alone. All this data and the accompanying visualizations can be found in Experian’s Dealer Positioning System®, or DPS, a dealership intelligence platform created expressly for auto retail. The DPS can surface recommendations on the models and ZIP Codes with the most opportunity, and a monthly Market Guidance call with one of our Performance Managers who can help you crystallize your strategy, track results, and hold you and your extended team accountable. Experian also has a growing list of agency partners who use the DPS to help clients like you shape and execute on effective marketing and advertising campaigns.

When dealerships market a particular make or model, they may only think of targeting by geography. In a previous article, we talked about hitting the mark for effectively geo-targeting down to the ZIP Code™ level. The trouble is this is only one half of the puzzle. You may know where you should target but might not know whom to target. What is the best way to create campaigns tailored to the individuals within the specific area you are targeting? If you already use Experian’s Dealer Positioning System (DPS), you have a leg up on this. Since we already talked about targeting by ZIP Codes, the next step finding out household attributions and profiles in those areas. The above example is a ZIP Code in Sun City West, Arizona. We see three different lifestyle segments sourced from Experian’s Mosaic®, a system that classifies households into 71 unique types and provides information about consumer’s choices, habits, and preferences. Within the 1,702 households in this Zip Code that registered a vehicle within a defined timeframe, we can determine the three primary types of household segments. As we can see, Footloose and Family Free dominates this area at 66%. This group consists of elderly couples and widowed individuals living active and comfortable lifestyles. Gold Carts and Gourmets, upscale retirees and empty-nesters in comfortable communities comes in at 20%. The remainder is Booming and Consuming, older empty-nesting couples and singles enjoying relaxed lives in small towns. This information gives us insight into the people living in various types of households within this particular ZIP Code and. These also show personal preferences for purchasing such as clothing, accessories, electronics, and so on, household marital status, and what types of vehicles they usually purchase. From this information, for Sun City West, Arizona, we can see that the average income in this ZIP Code is $67,000. After we look at the Mosaic profile of households, we can look at advertising propensity and channel dominance. These demonstrate how vehicles buyers in this ZIP Code were influenced in their purchase decision and shows what advertising influenced them the most. Traditional advertising such as newspaper, TV, or radio was more effective versus Direct Mail in this area with a ratio of 8:7. The difference between Email and Direct Mail for channel dominance is 1:1. That’s good because it means consumers here were equally responsive to both emails and direct mail. The left side of the table displays the type of households you can target, but the right side is all about how to best market to them. “Messaging Attributes” indicates the top key messaging that influenced the people in this ZIP Code’s buying decision. For this ZIP Code, Buy American is the top attribute. Consumers in this segment would like to know the history of your dealership, and details of your community involvement, and if your vehicles are made in America. If we go 9% lower, we see Look at me Now. This messaging focuses on customer relationships, dealership reputation, and gifts for going on test drives. Finally, there is On the Road Again. Here, focus is on customer testimonials, base trim levels of vehicles, and simple, value-focused messaging. As a dealer, you have three effective messaging attributes that you can use to bring consumers from this ZIP Code into your store. Effectively marketing your vehicle to consumers is easier once you know to whom you’re marketing. By using the Lifestyle Cluster and Mosaic lifestyle segmentation system, you can see not only who you are targeting but what kind of marketing they prefer. Along with idenitfying which ZIP Codes to target, figuring out what marketing attributes resonate with these consumers means you’ll provide the right message in the right place to the right consumer.

Throughout the year, there are certain models that are incredibly popular. SUVs and crossovers fly off the shelves during the wintertime while down south, the pickup-truck is the sales king. There are times when less popular vehicles flood your inventory, creating stress for your sales team to try and get them into the hands of customers. The good news for dealers is that you don’t need to panic when strange bonus programs are floated out by the manufacturer. Data-driven methods can be used to find potential buyers. The upshot of this is dealers don’t have to wait for buyers to waltz into their showroom. Although you can pick a specific model based on incentives, it is a good idea to review your model goals to confirm they are realistic. Based on the models you are trying to move, identify the sales trends by unit and geography. This analysis may help you discover the vehicle margin opportunity isn’t worth the advertising investment. On the other hand, you may learn competitors are selling a plethora of that model and there is plenty of room to conquest market share. Always let data be your guide. Checking a vehicle’s popularity can determine if you should market it. If the model’s popularity in your geography is growing, it will be easier since potential consumers are going into showrooms, asking questions, and doing research online. On the flip side, a vehicle with declining popularity is more difficult, and therefore more expensive, to market. As vehicles become unpopular or out-of-season, aggressive pricing may be in-store. In the past, the “spray and pray” method was what dealers and marketers would use, simply hoping that your campaign would find your target. Today, the best practice is to pinpoint the demand for your model by analyzing your pre-determined market radius to identify those ZIP Codes™ which show the most interest. For example, narrowing down to neighborhoods showing recent sales of your model can help identify future purchase demand. When combined with demographic, psychographic, web analytics, and your CRM data, the formula for determining model-specific demand becomes a precise science. Determining where to market is one thing, but identifying the in-market customer is another thing altogether. To identify the persona for potential purchasers of your models, utilize a system like Experian’s Dealer Positioning System. It helps determine the demographics and psychographics of consumers along with various buying patterns. This persona will include what interests consumers of your model and what they value in a marketing message. While creating the persona, think about what kind of marketing would be the most effective. Are your customers on social media and would they prefer digital advertising? Perhaps a more traditional approach with direct mail or by phone? Understanding their preferences will indicate which approach will most effectively resonate with them. Now campaigns for your model of choice can begin. Use the ZIP Codes and demographics of your highest potential customers to create an effective media plan. Based on the data, craft out digital, traditional, or other campaign types that can be run successfully. Focus on the features that will most appeal to your key demographic– all-wheel-drive, navigation, advanced safety features, made in America, etc. Moving that model off the lot and onto the customer’s driveway does not have to be difficult. If the model is not popular in the first place or it isn’t the right time to market it, you may not want to spend money trying to promote it. With the methods we stated earlier, selling a vehicle to customers based on geotargeting and specific marketing messages make moving even the most unwanted vehicle easier. Also, remember the where, who, and what. Where are you targeting your customers, who are your customers, and what medium are you going to use? Using this can help to move that model and grant you sales success.

At their heart, car dealers have always been marketers. It's part of learning the trade and understanding the business to gain natural insight into modern marketing and advertising practices. One could even argue that the experience gained through knowledge passed down, trial and error, and exposure to the automotive game itself can yield better strategies than a marketing degree. With all that said, it's still important to have the right data to guide the decisions as well as the tools necessary to decipher the data. Although we have a vast amount of information at our fingertips, it's very possible to truly build on "actionable data" and allow it to define the parameters for a dealership's marketing strategy. One of the most important things to consider when you're building and enhancing your strategies is that the data allows for decision making on the macro and micro levels. We see trend reports, analytics, and test cases that can influence decisions on both sides of the spectrum. Making decisions on the macro level means wholesale changes or additions. For example, the overall effectiveness of a particular classified advertising website can be broken down to determine whether or not it's making the right type of impact. Dealers have so many options today to advertise both online and offline, so making sure that any particular venue is effective is key to success. On the micro level, decisions can be made about how to position the dealership within the individual venues. You may be a big believer in search pay-per-click advertising, for example, and data can help to guide you or your vendor partners to position the dealership properly on search. Knowing which messages about individual cars are effective can be a guide. Then, understanding what zip codes have the highest opportunity level for the individual model can mold your PPC spend, while demographic data can drive effective messaging and help you optimize campaign creative and landing pages. Having access to the data is only the first step. Looking at the data appropriately is an important second step that many dealers are missing. Putting it all together into a decision-driving model is the step that almost every dealer should embrace to allow them to make the best decisions, macro or micro.

Benjamin Franklin famously said that nothing in life is certain except death and taxes. While that may be true, I think we can add another item to the list — traffic. An unfortunate part of many people’s day, traffic is an inevitable consequence when moving from point A to point B, especially when you consider the sheer volume of vehicles on the road. According to the latest research from Experian, the number of vehicles in operation (VIO) has jumped 5.7 million, going from 265.3 million in Q3 2016 to 271 million in Q3 2017. In fact, more than 17 million new vehicles hit the road in the United States, with just 11.4 million exiting operation. Numbers of that size can be hard to process, so let’s focus on something more relatable. When you’re stuck in traffic, what types of vehicles are inching along at a snail’s pace with you? No matter which state you live in, chances are you’ll see lots of full-size pickup trucks. Why? The top vehicle segment in 42 out of the 50 states is full-size pickups. The only exceptions are Hawaii — which has small pickup trucks as the number one segment — and Rhode Island, New York, New Jersey, Connecticut, Massachusetts, California and Maryland, which prefer midrange standard cars. If you think about it, these exceptions make sense. Residents of the East Coast commuter states and California probably prefer smaller vehicles because they’re more fuel efficient and it’s easier to find parking. But if you talk to a pickup truck owner, you’ll almost certainly hear why trucks are the best vehicle to own. Not surprisingly, full-size pickups aren’t just the top segment in most states; they also make up the largest vehicle segment currently on the road, at 15.3 percent. In terms of top models for full-size pickups, the Ford F-150 and Chevy Silverado 1500 are the top two best-selling trucks nationwide. Overall, Ford and GM still hold the largest market share across all makes and models. Toyota showed the greatest market share growth, going from 12.5 percent in 2016 to 13.6 percent in Q3 2017. For more information about Experian’s most recent VIO data, watch our latest webinar.
Below is our 5 Results for Dealers and Agencies Using DPS infographic.

When gearing up to buy a car, having a checklist of things to look for is important. Happily, it looks like consumers have added something new to the top of that list: managing their credit better. According to Experian’s latest State of Automotive Finance Market report, the average credit score for purchasing a vehicle has increased four points across the board, reaching 722 for new vehicles and 682 for used vehicles. That four-point increase may seem insignificant, but it reveals that consumers are actively managing their credit. With the recent trepidation over the so-called subprime auto finance bubble, the positive change is great news for people in the market to get a new ride. Per the Q3 report, subprime originations reached the lowest level of market share since 2012 (16.6 percent), while prime and super-prime originations showed the largest increases in market share. So what does all this mean? In addition to better managed credit, the increased market share of prime and super-prime consumers shows that industry professionals are leveraging data and analytics when making lending decisions. So if you’re looking to buy a car soon, how can you use that knowledge to your advantage? About six months before zooming to the dealership, take the time to check your credit report to make sure there are no surprises when a potential lender looks at it. Once you know where you stand, you can take steps to improve your credit (if needed) by paying bills on time, keeping balances low and not applying for any new credit before you’re ready to buy that car. Your credit is in good shape, so now what? When car shopping, don’t just look into vehicle make and model. Consider your financing options as well. Different lenders offer different terms and conditions, so comparing options can make sure that you’re getting the best deal possible. For example, our Q3 report shows that credit unions and captive financers (like Ford Motor Credit or Toyota Financial Services) are earning more customers and taking a greater market share of auto lending, at 21 percent and 29.8 percent, respectively. Banks still hold the largest percentage of auto loans at 32.9 percent, but they don’t dominate auto financing like they once did. Leasing is another financing option. Consumers often choose to lease because of lower monthly payments ($412 for a new lease as opposed to $502 for a new loan). The report shows that leasing continues to be a large part of new auto financing, coming in at 29 percent of all financed new vehicles. Lastly, the report shows that loan terms continue to be extended, with the average length of a loan hitting 69 months for new cars and nearly 64 months for used. Extending loan terms can lower your monthly payment, but you should use it mindfully, so the total cost of the vehicle loan doesn’t exceed your budget. For more information about the current State of the Automotive Finance Market report or to view a recording of the webinar, visit our website.

How do credit unions stack up in a pack filled with heavy-hitting banks and aggressive online lenders? Do credit scores, debt levels and utilization rates look different between credit union members and non-credit union members? Where is the greatest concentration of credit unions in the country? Experian took a deep dive into the data and performance surrounding the credit union universe in their first-ever “State of Credit Unions” report, featuring insights utilizing data from both 2015 and 2017. What did the analysis reveal? “In general, we saw credit unions continuing to increase their auto lending market share, but we also saw them growing their member relationships and increasing market share in mortgage, personal loan and bankcard,” said Michelle Cocchiarella, the Experian analyst who pulled the data. A few of the key data points include: Credit union auto originations increased from 1.54M new accounts in Q1 2015 to 1.93M in Q1 2017 – a 25% increase. And not only did originations rise dramatically in this space, but credit unions topped banks, captives and other finance sources. Credit union auto market share rose 5% between Q1 2015 and Q1 2017, while bank market share declined by 4%. Credit unions also saw growth in the personal loan arena, with market share rising 2% between Q1 2015 and Q1 2017. Still, with the rise of online lenders, that sector saw a 7% increase during the same period. Banks declined by 5%. While most bankcards are opened with banks, credit unions did experience an 18% increase in bankcard originations from Q1 2015 to Q1 2017. Market share rose 1% between Q1 2015 and Q1 2017 for credit unions in the bankcard space. Banks reign with market share at 96%. Credit union mortgage market share rose 7% between Q1 2015 and Q1 2017. Banks declined by 4%. “Collectively, the credit union space is enjoying remarkable membership and loan growth,” said Scott Butterfield, principal of Your Credit Union Partner, a consulting agency to credit union leaders. “However, this bountiful experience is not enjoyed at all credit unions. The financial services environment has never been more competitive. The best credit unions are relentless at investigating a better way to find and serve more members, and as such, are seeing great growth.” For the complete results, including insights on how credit union members with at least one trade compare to non-credit union members, access the report on our credit union insights page.

When discussing automotive lending, it seems like one term is on everyone’s lips: “subprime auto loan bubble.” There’s always someone who claims that the bubble is bursting. But a level-headed look at the data shows otherwise. According to our Q1 2017 State of the Automotive Finance Market report, 30-day delinquencies dropped and subprime auto lending reached a 10-year record low for Q1. The 30-day delinquency rate dropped from 2.1 percent in Q1 2016 to 1.96 percent in Q1 2017, while the total share of subprime and deep-subprime loans dropped from 26.48 percent in Q1 2016 to 24.1 percent in Q1 2017. The truth is, lenders are making rational decisions based on shifts in the market. When delinquencies started to go up, the lending industry shifted to more creditworthy customers. This is borne out in the rise in customers’ average credit scores for both new and used vehicle loans: The average customer credit score for a new vehicle loan rose from 712 in Q1 2016 to 717 in Q1 2017. The average customer credit score for a used vehicle loan rose from 645 in Q1 2016 to 652 in Q1 2017. In a clear indication that lenders have shifted focus to more creditworthy customers, super prime was the only risk tier to grow for new vehicle loans from Q1 2016 to Q1 2017. Super-prime share moved from 27.4 percent in Q1 2016 to 29.12 percent in Q1 2017. All other risk tiers lost share in the new vehicle loan category: Prime — 43.36 percent, Q1 2016 to 43.04 percent, Q1 2017. Nonprime — 17.83 percent, Q1 2016 to 16.96 percent in Q1 2017. Subprime — 10.64 percent, Q1 2016 to 10.1 percent in Q1 2017. For used vehicle loans, there was a similar upward shift in creditworthiness. Prime and super-prime risk tiers combined for 47.4 percent market share in Q1 2017, up from 43.99 percent in Q1 2017. At the low end of the credit spectrum, subprime and deep-subprime share fell from 34.31 percent in Q1 2016 to 31.27 percent in Q1 2017. The upward shift in used vehicle loan creditworthiness is likely caused by an ample supply of late model used vehicles. Leasing has been on the rise for the past several years (and is at 31.06 percent of all new vehicle financing today). Many of these leased vehicles have come back to the market as low-mileage used vehicles, perfect for CPO programs. Another key indicator of the lease-to-CPO impact is the rise in used vehicle loan share for captives. In Q1 2017, captives had 8.3 percent used vehicle loan share, compared with 7.2 percent in Q1 2016. In other findings: Captives continued to dominate new vehicle loan share, moving from 49.4 percent in Q1 2016 to 53.9 percent in Q1 2017. 60-day delinquencies showed a slight rise, going from 0.61 percent in Q1 2016 to 0.67 percent in Q1 2017. The average new vehicle loan reached a record high: $30,534. The average monthly payment for a new vehicle loan reached a record high: $509. For more information regarding Experian’s insights into the automotive marketplace, visit https://www.experian.com/automotive.
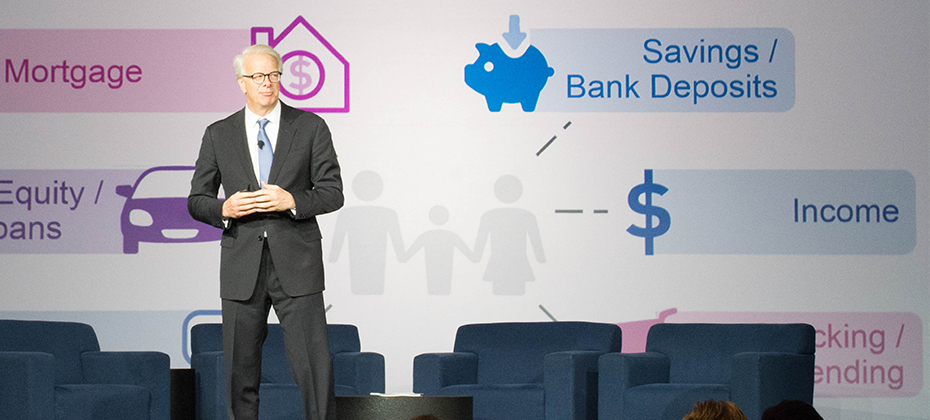
So many insights and learnings to report after the first full day of 2017 Vision sessions. From the musings shared by tech engineer and pioneer Steve Wozniak, to a panel of technology thought leaders, to countless breakout sessions on a wide array of business topics … here’s a look at our top 10 from the day. A mortgage process for the digital age. At last. In his opening remarks, Experian President of Credit Services Alex Lintner asked the audience to imagine a world when applying for a mortgage simply required a few clicks or swipes. Instead of being sent home to collect a hundred pieces of paper to verify employment, income and assets, a consumer could click on a link and provide a few credentials to verify everything digitally. Finally, lenders can make this a reality, and soon it will be the only way consumers expect to go through the mortgage process. The global and U.S. economies are stable. In fact, they are strong. As Experian Vice President of Analytics Michele Raneri notes, “the fundamentals and technicals look really solid across the countries.” While many were worried a year ago that Brexit would turn the economy upside down, it appears everything is good. Consumer confidence is high. The Dow Jones Index is high. The U.S. unemployment rate is at 4.7%. Home prices are up year-over-year. While there has been a great deal of change in the world – politically and beyond – the economy is holding strong. The rise of the micropreneur. This term is not officially in the dictionary … but it will be. What is it? A micropreneur is a business with 0 to 4 employees bringing in no more than $200k in annual revenue. But the real story is that numbers show microbusiness are improving on many fronts when it comes to contribution to the economy and overall performance compared to other small businesses. Keep an eye on these budding business people. Fraud is running fierce. Synthetic identity losses are estimated in the hundreds of millions annually, with 50% year-over year growth. Criminals are now trying to use credit cleaners to get tradelines removed from used Synthetic IDs. Oh, and it is essential for businesses to ready themselves for “Dark Web” threats. Experts advise to harden your defenses (and play offense) to keep pace with the criminal underground. As soon as you think you’ve protected everything, the criminals will find a gap. The cloud is cool and so are APIs. A panel of thought leaders took to the main stage to discuss the latest trends in tech. Experian Global CIO Barry Libenson said, “The cloud has changed the way we deliver services to our customers and clients, making it seamless and elastic.” Combine that with API, and the goal is to ultimately make all Experian data available to its customers. Experian President of Decision Analytics Steve Platt added, “We are enabling you to tap into what you need, when you need it.” No need to “rip and replace” all your tech. Expect more regulation – and less. A panel of regulatory experts addressed the fast-changing regulatory environment. With the new Trump administration settling in, and calls for change to Dodd-Frank and the Consumer Financial Protection Bureau (CFPB), it’s too soon to tell what will unfold in 2017. CFPB Director Richard Cordray may be making a run for governor of Ohio, so he could be transitioning out sooner than the scheduled close of his July 2018 term. The auto market continues to cruise. Experian’s auto expert, Malinda Zabritski, revealed the latest and greatest stats pertaining to the auto market. A few numbers to blow your mind … U.S. passenger cars and light trucks surpassed 17 million units for the second consecutive year Most new vehicle buyers in the U.S. are 45 years of age or older Crossover and sport utility vehicles remain popular, accounting for 40% of the market in 2016 – this is also driving up finance payments since these vehicles are more expensive. There are signs the auto market is beginning to soften, but interest rates are still low, and leasing is hot. Defining alternative data. As more in the industry discuss the need for alternative data to decision, it often gets labeled as something radical. But in reality, alternative data should be simple. Experian Sr. Director of Government Affairs Liz Oesterle defined it as “getting more financial data in the system that is predicted, validated and can be disputed.” #DeathtoPasswords – could it be a reality? It’s no secret we live in a digital world where we are increasingly relying on apps and websites to manage our lives, but let’s throw out some numbers to quantify the shift. In 2013, the average U.S. consumer had 26 online accounts. By 2015, that number increased to 118 online accounts. By 2020, the average person will have 207 online accounts. When you think about this number, and the passwords associated with these accounts, it is clear a change needs to be made to managing our lives online. Experian Vice President David Britton addressed his session, introducing the concept of creating an “ultimate consumer identity profile,” where multi-source data will be brought together to identify someone. It’s coming, and all of us managing dozens of passwords can’t wait. “The Woz.” I guess you needed to be there, but let’s just say he was honest, opinionated and notes that while he loves tech, he loves it even more when it enables us to live in the “human world.” Too much wonderful content to share, but more to come tomorrow …

It’s more than mercury that will be up this summer. As temperatures climb, so do automotive sales, which often reach annual highs during the warmest months of the year. Fueled by pent-up demand coming out of the recession, historically low interest rates, and increased competition among both manufacturers and lenders, auto sales are continuing to be a bright spot in the U.S. economy. Summer sales spike According to recent research by Experian Automotive, 2015 sales of new non-luxury vehicles began rising in May and peaked in August at nearly 20 percent above the monthly average for the year. It is not surprising, given the number of notable manufacturer marketing campaigns that often air through the summer months, beginning with Memorial Day and running all the way through Labor Day weekend. The projection is that this trend will continue in 2016. Financing moves metal Financing continues to play an important role in facilitating new car sales. Experian research shows a consistent increase in the percentage of new vehicles sold with financing with the trend reaching a period high of 85.9 percent in Q4 2015, a 2.3 percent increase over the previous year. The increased financing, is due in part, to continued post-recession liquidity. As the economy has rebounded, lenders have re-emerged with attractive financing rates for buyers. In addition, captive lenders are continuing to support manufacturers with 0 percent subvention offers to increase sales. Total loan value is on the rise as well, reaching $29,551 in Q4 2015, a 4.1 percent increase over the previous year. Average MSRP is trending up too, but at a slower year-over-year rate of 3.6 percent. The slower growth in MSRP relative to total loan value is leading to increased loan-to-value ratios which reached 109.4 percent in Q4 2015. The increases in loan value and MSRP are putting pressure on monthly payment with average new vehicle payments reaching $493 per month on new loans in the fourth quarter. Seeking relief, consumers are turning to longer loan terms and leasing to maintain lower payments. As a result, average new vehicle loan terms ticked slightly higher to 67 months while lease penetration on new vehicles reached 28.9 percent, a 19 percent increase over the previous year. Leveraging the trends Timing is everything when it comes to auto lending. Direct mail remains an effective communication tool for lenders, but mass mailers without regard to response rates yield poor ROIs and put future campaigns in jeopardy. Targeting consumers who are most likely to be in the market at a point in time can increase response rates and improve overall campaign performance. Experian’s In the Market Model – Auto leverages the power of trended credit data to identify consumers that will be most receptive to an offer. By focusing on high-propensity consumers, lenders can conduct more marketing campaigns during the year with the same budget and achieve supercharged results. Context-based marketing allows lenders to tailor offers by leveraging insights on a consumer’s existing loans. Product offers can additionally be customized based on estimated interest rates, months remaining, or current loan balance on open auto loans. Targeted refinance offers can also be delivered to consumers with high interest rates or focus new-loan offers on consumers with minimal months or balance remaining on existing loans. Understanding current auto loans allows lenders to target offers that are relevant to their prospects and gain an advantage over the competition. Increases in loan-to-value (LTV) ratios at origination and longer loan terms are putting many consumers in deep negative equity positions. As a result, many consumers will not qualify for refinance offers without significant down payments leading to low underwriting conversion rates and poor customer experience. Lenders seeking to improve on these metrics should leverage Experian’s Auto Equity Model, which provides an estimate of the amount of equity a consumer has in their existing auto trades. Focusing refinance offers on consumers with negative equity, while suppressing those with deep negative positions, can help improve response rates while minimizing declines due to LTV requirements. Takeaways Lenders should be gearing up for the summer auto sales spike. Proactive strategies will allow savvy marketers to deploy capital and grow their portfolio by taking advantage of customer insight. Timing and context matter, and as auto sales trends reveal, now is the opportune time to optimize marketing efforts and capitalize on the season.