Tag: unemployment

As lenders and consumers emerge from the pandemic, predicting the attributes of the “new normal” will be difficult. Consumer demand, credit characteristics and economic conditions have all been affected by the pandemic – changing the way we think about doing business. Regulators and legislators have also developed new priorities and expectations for financial institutions. Clint Ivester, Experian’s Solutions Consultant and VP of Sales, joined Lee Gilley and Jonathan Kkolodziej, Partners for Bradley, to share their observations from the past year at AFSA’s 2021 Independents Conference. They also discussed recommendations financial institutions should consider to achieve the best possible posture with respect to compliance and business readiness. Here are a few Q&A highlights: Q: How are stimulus packages and increased government spending affecting economic conditions? A: [Ivester]: Our Experian forecast shows that the economy will grow 6% in 2021. That is well above the 2.5% average we have seen over the last four decades and highest rate since 1983. While the economy is oriented toward growth, how strong that growth is going to be will really depend on how well things go when the “training wheels” are taken off, how robust the recovery is for lower-income workers, and how consumer spending habits have been altered by the pandemic. *Data sources include Bureau of Economic Analysis and Experian’s “COVID-19 Economics Scenarios” April 2021 Report Q: How should businesses be assessing future consumer demand, conditions, and broader economic conditions over the next few quarters? A: [Ivester]: To answer this question, we should consider some factors including unemployment. What happens with lower income workers will have a big impact on where consumer spending goes post-stimulus. While the overall economy is set for solid growth there are still 8 million people out of work with the vast majority being lower income workers. Employment for lower income workers is still down more than 20%. These workers are set to lose the most by the phase out of the federal pandemic unemployment programs and are the highest risk to lose all unemployment benefits. However, if we see a strong jobs recovery – as is very possible – in bars, restaurants, hotels and other industries, these individuals will return to more normal spending habits and consumer spending should remain robust. *Data source includes Opportunity Insights Economic Tracker Watch the full session to hear more about the discussion. For more resources and content on this topic, please visit our Look Ahead Resources page or contact us for more information.

Experian recently announced its expansion into Employer Services and the release of a new suite of real-time income and employment verification products, Experian Verify™. The COVID-19 pandemic amplified lenders' need for deeper insights into a consumer's financial situation. At the same time, employers were flooded with record-breaking unemployment claims, while managing stay-at-home orders, income and employment verification fulfillment requests, and more. "We're committed to helping employers, businesses, lenders, and consumers on the road to recovery from the pandemic and beyond," said Alex Lintner, Group President Experian Consumer Information Services. "To support this, we're building two businesses: Experian Employer Services and Verification Solutions. These businesses will create meaningful change and provide our clients with competitive options to achieve their verification needs while helping improve access to credit for consumers." With Experian Verify, lenders can quickly and easily create a more complete picture of a consumer's financial situation by verifying an applicant's income and employment status. Powered by our growing network of payroll and proprietary employer data, Experian Verify offers lenders flexible and secure access to income and employment records. With a consumer's consent, lenders can request the information from Experian and an income and employment report can be delivered to lenders through an API, online Experian dashboard, or paired with an Experian credit report. "As we begin to recover from the COVID-19 pandemic and employers are reopening their doors, we're confident we have assembled the best-of-the-best to help employers overcome their toughest challenges. We're committed to leveraging our combined capabilities and focus on high-touch customer service to deliver secure, scalable and transparent services to employers," said Michele Bodda, President of Experian Mortgage, Employer Services and Verification solutions. Visit us for more information on Experian Verify and Experian's Employer Services. Contact us

Recently, I wrote about how Experian is assisting NASWA (National Association of State Workforce Agencies) with identity verification to help mitigate the spike in fraudulent unemployment insurance claims. Because of this I was not all that surprised when I found a letter in my mailbox from the Texas Workforce Commission with a fraudulent claim using my identity, inspiring me to follow up on this topic with a focus on fraud prevention best practices. Identity theft is on the rise According to Experian data analysis and a recent study on unemployment insurance fraud, at least 25% of new claims are a result of identity theft. This is 50 times higher than what we have traditionally seen in the highest ID theft fraud use case, new credit card applications, which generally amounts to less than 0.5% of new applications. Increasing digitization of the last few years—culminating in the huge leap forward in 2020—has resulted in a massive amount of information available online. Of that information, a reported 1.03 billion records were exposed between 2016 and 2020. There are currently approximately 330 million Americans, so on average more than three records per person have been exposed, creating an environment ripe for identity theft. In fact, a complete identity consisting of name, address, date of birth, and Social Security number (SSN) can be purchased for as little as $8. This stolen data is then often leveraged by both criminal rings who are able to perpetrate fraud on a large scale and smaller scale opportunists – like the ones in Riverside, CA leveraging access to identities of prison inmates. Fraud prevention through layered identity controls In the 20 years that I have been combatting ID theft both in the private and public sectors, I’ve learned that the most effective identity proofing goes beyond traditional identity resolution, validation, and verification. To be successful, you must take advantage of all available data and incorporate it into a layered and risk-based approach that utilizes device details, user behavior, biometrics, and more. Below, I outline three key layers to design an effective process for ID proofing new unemployment insurance claims. Layer 1: Resolve and Validate Identities Traditional identity data consists of the same basic information—name, address, date of birth, telephone number, and SSN—which is now readily available to fraudsters. These have been the foundation for ID proofing in the past and are still critical to resolving the identity in question. The key is to also include additional identity elements like email address and phone number to gain a more holistic view of the applicant. Layer 2: Assess Fraud Risk Determining an identity belongs to a real-life subject is not sufficient to mitigate the risk of ID theft associated with a new unemployment insurance claim. You must go beyond identity validation to assess the risk associated with their claim. Risk assessment risk falls into two categories – identity and digital risk. Identity Risk When assessing a claim, it’s important to check the identity for: Velocity: How often have you (or other states) seen the information being presented with this application? Has the information been associated with multiple identities? Recency of change: How long has the identity been associated with the contact information (phone, email, address, etc.)? Red flags: Has the subject been a recent victim of ID theft, or are they reported as deceased? Synthetic Identity: Are there signs that the identity itself is fictitious or manipulated and does not belong to a real-life person? Digital Risk Similar to the identity risk layer above, the device itself and how the subject interacts with the device are significantly important in identifying the likelihood a new claim is fraudulent. Device risk can be assessed by utilizing geolocation and checking for inconsistent settings or high-risk browsers, while behavioral risk might check for mouse movement, typing speed, or screen pressure. Layer 3: Verify Highest Risk Subjects The final stage in this process is to require additional verification for the highest risk claims, which helps to balance the experience of your valid subjects while minimizing the impact of fraud. Additional steps might include: Document verification: Scanning a government-issued ID (driver’s license, passport, or similar), which includes assessing for document security features and biometric comparison to the applicant. One-time passcode (OTP): It is key to deploy this sparingly only to phone numbers that have been associated with the subject for a significant time frame and incorporate checks to determine if it is at high risk (e.g., recently ported or forwarded). Knowledge-based verification (KBV): Leveraging non-public information from a variety of sources. By adding additional, context-based identity elements, it becomes possible to improve the three main objectives of most agencies’ identity proofing process – get good constituents through the first time, protect the agency and citizens from fraud, and deliver a smooth and secure customer experience in online channels. While there’s no quick fix to prevent unemployment insurance fraud, a layered identity strategy can help prevent it. Finding a partner that has a single, holistic solution empowers agencies to defend against unemployment insurance fraud while minimizing friction for the end-user, and preparing for future fraud schemes. To learn more about how you can protect your constituents and your agency from unemployment insurance fraud request a call today. Contact us

In the wake of unprecedented unemployment fraud since the start of COVID-19, Experian announced it was selected as the exclusive partner for identity and fraud verification for the Unemployment Insurance (UI) Integrity Center’s centralized Identity Verification (IDV) capability. IDV is available to state agencies at no cost through UI Integrity Center, which is operated by the National Association of Workforce Agencies (NASWA) in partnership with the U.S. Department of Labor. With the Federal Bureau of Investigations (FBI) reporting a spike in fraudulent unemployment insurance claims complaints related to COVID-19, it’s more important than ever for state agencies to use innovative solutions to verify identities that are applying for unemployment insurance to protect consumers. If improper unemployment insurance payments are made to fraudsters, the efforts of the CARES Act could be largely wasted. The IDV capability leverages Experian’s Precise IDTM to provide a centralized identity verification and proofing solution. Precise ID combines identity analytics with advanced fraud risk models to distinguish various types of fraud, which can help state agencies maximize time and resources. When state agencies submit claims, the IDV solution will return ID theft scoring and associated cause codes, enabling them to assess whether a claim may be fraudulent. “Due to the COVID-19 health crisis, unemployment is high, with over roughly 60 million Americans filing for unemployment since March,” said Robert Boxberger, president of Experian’s Decision Analytics in North America. “At Experian, we’re proud to have a strong culture dedicated to continuous innovation that helps protect consumers’ financial health. We’re taking that same consumer focus and helping make the unemployment insurance application process more efficient and safer for constituents.” The Integrity Data Hub (IDH) is a robust, multi-state data system that contains a continuously expanding set of sources to provide advanced cross-matching and analytic capabilities to states. It is designed to be easily implemented by any state Unemployment Insurance agency, regardless of claim volume, technology, or access to internal resources. The IDH was designed and built using the latest National Institute of Standards and Technology IT security standards, including the use of asymmetric encryption and other techniques to ensure the security of sensitive data. “We’re excited to partner with Experian and utilize its Precise ID solution to assist states in mitigating fraud during these unprecedented times,” said Scott Sanders, NASWA Executive Director. “States are finding this to be a very valuable tool and we are pleased that we can offer this solution to states through our partnership with the U.S. Department of Labor.” Read Press Release Learn More About Precise ID

Consumer behavior and payment trends are constantly evolving, particularly in a rapidly changing economic environment. Faced with changing demands, including an accelerated shift to digital communications, and new regulatory rules, debt collectors must adapt to advance in the new collections landscape. According to Experian research, as of August, the U.S. unemployment rate was at 8.4%, with numerous states still having employment declines over 10%. These triggers, along with other recent statistics, signal a greater likelihood of consumers falling delinquent on loans and credit card payments. The issue for debt collectors? Many debt collection departments and agencies are not equipped to properly handle the uptick in collection volumes. By refining your process and capabilities to meet today’s demands, you can increase the success rate of your debt collection efforts. Join Denise McKendall, Experian’s Director of Collection Solutions, and Craig Wilson, Senior Director of Decision Analytics, during our live webinar, "Adapting to the New Collections Landscape," on October 21 at 10:00 a.m. PT. Our expert speakers will provide a view of the current collections environment and share insights on how to best adapt. The agenda includes: Meeting today’s collections challenges A Look at the state of the market Devising strategies and solving collections problems across the debt lifecycle Register now

Since the start of the COVID-19 health crisis, gross domestic product (GDP) has continued to fall in the U.S. In fact, the GDP collapsed at a 32.9% annualized rate last quarter, which is the deepest decline since 1947. But as some states throughout the U.S. begin to relax their stay-at-home orders and start to reopen businesses, economists are taking note of how this will affect the nation’s recovery as a whole. When it comes to tracking the nation’s economic recovery, economists and policymakers need to account for all of the factors that will influence the outcome. This includes tracking the performance of individual states and understanding each state’s trajectory and recovery prospects. There are many factors that will impact each state’s trajectory for recovery. One example, in particular, can be seen in a state’s preparedness level and rainy day fund that’s set aside for emergencies. At the onset of the pandemic, many states were unprepared for the financial crisis. The Government Finance Officers Association recommends that states set aside at least two months of operating expenses in their rainy day funds – or roughly 16% of their general fund. However, although some states had set aside some budget to prepare for a recession, it was simply not enough. Only a few states were able to fulfill this requirement. Other factors that will impact each state’s recovery include: the efficiency of its unemployment program, state lockdown measures, and the concentration of jobs in vulnerable industries. Our new white paper, featuring key insights from Joseph Mayans, Principal Economist with Advantage Economics, provides a deep dive on: The economic landscape at the onset of the pandemic Statewide discrepancies for unemployment programs, lockdown measures, and labor markets Underlying factors that determine a state’s recovery prospects Why tracking state-level economies is critical for national recovery Listen in as he describes the importance of having a different perspective when tracking the national economy and download the white paper for greater insights. Download White Paper Now

As the COVID-19 pandemic continues to create uncertainty for the U.S. economy, different states and industries have seen many changes with each passing month. In our July edition of the State of the Economy report, written by Principal Economist Joseph Mayans, we’ll be breaking down the data that financial institutions can use to navigate a recovery. Labor markets and state-level employment impact Prior to the pandemic, unemployment in the U.S. was at a 50-year low, at an astonishing rate of 3.5%. Following the start of the pandemic, research shows that unemployment rose from 6.2 million in February to 20.5 million in May 2020, and sent the unemployment rate soaring to 14.7%. However, the data from last month’s State of the Economy Report revealed that the unemployment rate began to decline, with 46 states seeing rises in new job opportunities. Although unemployment started to increase, many states (like Nevada) saw a 25.3% unemployment rate statewide. The numbers for June are much more promising, and reveal a continuous uptick in the number of jobs added. The unemployment rate in the U.S. also fell from 13.3% to 11.1%. The impact to industries COVID-19 had major impacts on every industry in the U.S., with the leisure and hospitality industry being the hardest-hit at 7.7 millions job lost. According to CNBC, “The large number of layoffs in this industry led the U.S. economy to its worst month of job losses in modern history.” However, job growth for the leisure and hospitality industry began to gain momentum in May, with 1.2 million jobs added. This can be attributed to a slow and gradual rollback of stay-at-home orders nationwide. As of June 2020, 4.8 million jobs have been added to this industry. The trade, transportation, and utilities, as well as education and health services, manufacturing, and business services industries also saw improvements in employment. The impact to retail sales Clothing stores, furniture, and sporting goods stores were only a few of the many retailers that saw heavy declines following lockdown orders. After two consecutive months of decline, retail sales finally rebounded by 17.7% in May, with the largest gains occurring in clothing stores (+188%). In June, retail sales continued to rise substantially, resulting in saw a v-shaped bounce. However, with unemployment benefits nearing the expiration date and the number of pandemic cases continuing to increase, recovery remains tentative. Our State of the Economy report also covers manufacturing, homebuilders, consumer sentiments, and more. To see the rest of the data, download our report for July 2020. We’ll be sharing a new report every month, so keep an eye out! Download Now
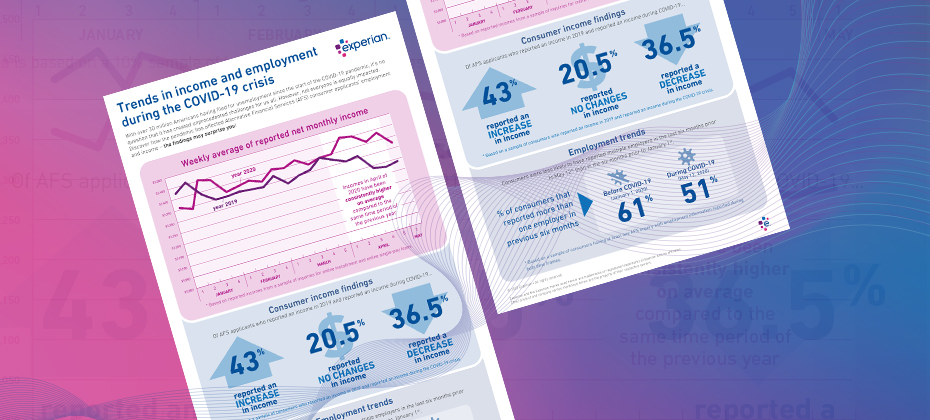
With many individuals finding themselves in increasingly vulnerable positions due to COVID-19, lenders must refine their policies based on their consumers’ current financial situations. Alternative Financial Services (AFS) data helps you gain a more comprehensive view of today's consumer. The COVID-19 pandemic has had far-reaching economic consequences, leading to drastic changes in consumers’ financial habits and behavior. When it comes to your consumers, are you seeing the full picture? See if you qualify for a complimentary hit rate analysis Download AFS Trends Report

The economic impact of the COVID-19 health crisis is ever-evolving and requires great flexibility and planning from lenders. Shannon Lois, Experian’s Senior Vice President, Analytics, Consulting and Operations, discusses what lenders can expect and next steps to take. Q: Though COVID-19 is catalyzing a sharp economic slowdown, many experts expect it to be temporary and liken it more to a global natural disaster than the prior financial crisis. What are your reactions? SL: There is still debate as to whether we will have a U-shaped or a V-shaped recession and its probable severity and longevity. Regardless, we are in a recession caused by a health pandemic with uncertainty of what it will mean for our global economy and without a clear view as to when it will end. The sooner we can contain the virus the more it will help to curtail the size of the recession. The unemployment rates and the consumer lack of confidence in the future will continue to contract spending which in turn will continue to propagate the recession. Our ability to limit COVID-19 over the coming months will have a direct impact in the economy, although the effects will probably linger on for six or more months. Q: From an economic perspective, what are the current trends we’re seeing? SL: Unemployment has skyrocketed and every business sector has been impacted although with different degrees of severity. In particular, tourism/hospitality, airlines, automotive, consumer products and retail have suffered. Consumers’ financial status varies and will continue to fluctuate, and credit conditions tighten while welfare payments increase. The government programs that have started will help, but they’re not enough to counter a prolonged recession. As some states seek to reopen and others extend their shelter in place orders, we will continue to see economic changes, with different sectors bouncing back or dipping further depending on their geographic location. Q: How does the economic slowdown compare to what we may have expected previously? SL: This recession is different than anything we have encountered previously not only because of the health concerns and implication of our population but because of the uncertainty of it all. As an example, social distancing has significantly and immediately impacted consumer demand but overall it is their low confidence in the future that will cause a continuous drop in discretionary and non-discretionary spending. Not only do we have challenges on the demand side, we also are seeing the same on the supply side with no automotive manufacturing occurring in the USA, and international oil flooding the market causing negative impact on domestic oil and the broad energy market. Q: How do the unemployment and liquidity challenges come into play? SL: The unemployment rate has already jumped to a record high. Most consumers are facing liquidity and affordability challenges and businesses do not have enough cash reserves to sustain them. Consumer activity has shifted drastically across all channels while lenders are exercising more caution. If this is a V-shaped recession (and hopefully it will be), then most activity is bound to spring back quickly in Q3. With companies safeguarding some jobs and the help of governments’ supplemental programs, businesses will restore supply and consumer demand will get a kick start. Q: What is the smartest next play for financial institutions? SL: The path forward requires several steps. First, understand your customers, existing and new. Refine your policies with the right information around your customers’ financial situations and extend programs (forbearance and loan payment forgiveness) as needed under the right guidelines. It’s also important to use refreshed data to lend to consumers and businesses who need it now more than ever, with the proper policies and fraud checks in place. Finally, increase your agility to operate effectively and dynamically with automation, interactive communication and self-serving digital tools. Experian is committed to helping lenders throughout these uncertain times. For more resources, visit our Look Ahead 2020 Resource Hub. Learn more About Our Expert Shannon Lois, Senior Vice President, Analytics, Consulting and Operations, Decision Analytics Shannon and her team of analysts, scientists, credit, fraud and marketing risk management experts provide results-driven consulting services and state-of-the-art advanced analytics, science and data products to clients in a wide range of businesses, including banking, auto, credit, utility, marketing and finance. Prior to her current role, she founded the Advisory Services practice at Experian, driving to actionable and proven solutions for our clients’ most pressing business problems.

There is no doubt that there will be many headlines published about the latest Bureau of Labor Statistics (BLS) jobs report. The official unemployment rate spiked to 14.7%, the highest level since the Great Depression, and employers shed an unprecedented 20.5 million jobs. However, given the scale and pace that businesses around the country are adjusting their workforces, these headline numbers – especially the official unemployment rate – fall short in capturing the nuances and internal dynamics of the crisis. To get a better picture of labor market health in the coming months, there are three other components reported in BLS’s employment release that require close attention: the underemployment rate, the labor force participation rate, and the employment-population ratio. Tracking underemployment The BLS reports six unemployment figures in its monthly employment release, U1 – U6. The most cited is the “official” unemployment rate, which is U3. However, in the current crisis, the more salient measure of unemployment is U6, which is often known as the “underemployment” rate. This is because the underemployment (U6) rate takes the unemployed and adds on part-time workers who want a full-time job (BLS calls this segment “part time for economic reasons”), plus marginally attached and discouraged workers (those who don’t think they can find work). Viewing the employment landscape through this lens provides greater insight into the pain points within the labor market. In April, the underemployment rose from 8.7% to 22.8% - the largest jump on record. A large contributor to the rise was a doubling of the number of part-time workers that wanted a full-time job. Mirroring what happened in previous downturns, the rise in this segment was caused by employers downshifting workers into part-time roles. The official unemployment rate will miss this insight as it classifies everyone who is working as “employed”, regardless if they worked one hour or 100 hours. Trends in the underemployment rate will be especially important to watch as the recovery gets underway. If employers are doubtful of a strong rebound, they may keep employees on as part time and forgo filling any full-time positions. Who’s in and who’s out of the labor force The labor force participation rate is the percentage of the working-age population (aged 16+) that is employed or searching for a job. A decline in the labor force participation rate means that people are leaving the workforce and are no longer looking for employment. April’s employment report showed labor force participation declining from 62.7% to 60.2%. Teenage participation was especially hard hit, dropping from 35.5% to 30.8% - the lowest level since the government started collecting the data in 1948. During the recovery phase, tracking what happens with labor force participation will provide insight into how potential workers perceive their chances of landing a job and if it is safe to return. A healthy (or improving) labor market will bring people off the sidelines in search of work, while a weak labor market will do the opposite. Get a clearer view with the employment-population ratio In the current environment where people are bouncing rapidly between employed, unemployed, underemployed, and out of the labor force, tracking the employment-population ratio provides a more stable baseline to view the economic environment. The latest data shows that the employment-population ratio dropped to the lowest level on record of 51.3% in April. This means that only half of people who are of working age in the U.S. are currently employed in some form. Unlike the unemployment rate, which is calculated by dividing the number of unemployed workers by the labor force and thus subject to more variation as people start and stop looking for work, the employment to population ratio is the percentage of the total working-age population that is currently employed. By having a more stable baseline, it is easier to locate trends and see through the market gyrations. And finally, why it matters The labor market is the backbone of the economy and is the engine that powers the US consumer. But the ongoing crisis and rapid reallocation of the workforce has made it difficult to get a clear picture on what is happening at the ground level. By going beyond the headlines, businesses and financial institutions can glean nuanced insights that provide a better view of where the opportunities lie and how the recovery is likely to unfold. Learn more

After two consecutive emergency meetings in March and numerous stimulus announcements, the Federal Open Market Committee (FOMC) finally got back on track and wrapped up their standard two-day meeting on April 29th. While Fed officials did not make any changes to the federal funds rate – which is currently sitting near zero - or to the level of purchases of treasuries and mortgage-backed securities, they did provide a glimpse into how long rates are likely to remain at their current levels. Hint: It is going to be a while. Understanding the Fed’s statement In order to get a clearer picture of what the Fed is thinking, skip the headlines and go straight to the source – the post-meeting press release. Here is the most important paragraph from their statement (with the key components underlined): “The ongoing public health crisis will weigh heavily on economic activity, employment, and inflation in the near term, and poses considerable risks to the economic outlook over the medium term. In light of these developments, the Committee decided to maintain the target range for the federal funds rate at 0 to 1/4 percent. The Committee expects to maintain this target range until it is confident that the economy has weathered recent events and is on track to achieve its maximum employment and price stability goals.” Just by taking the statement at face value, it is clear the Fed is going to keep rates where they are for some time, but for how long? That depends on how the key phrases are interpreted. The first, “over the medium term”, seems simple but requires some detective work. What does “medium term” mean? In the post-meeting press conference, the Fed Chairman was asked this question and he alluded that it likely means a year or more. So, there is part 1 - the Fed expects to keep rates near zero for at least a year. That is not all that surprising, but it does provide a floor: a minimum timeframe. Key phrase 2, however, requires a bit more effort but is where the real story lives. The dual mandate is no longer a balancing act “The Committee expects to maintain this target range until it is confident that the economy has weathered recent events and is on track to achieve its maximum employment and price stability goals.” There is a lot of economics in that sentence. The Fed has been mandated by Congress to achieve two primary goals – maximum employment and price stability (inflation near 2%). These two goals, or the “dual mandate” as they are often referred to, seem simple but have historically been at odds. The thinking went that if the Fed kept interest rates low to support employment, then inflation would rise. And if the Fed increased interest rates to control inflation, then employment would decline. A delicate balance - at least it was thought. Somewhere in the last couple of years Fed officials have realized that even after a decade of near-zero interest rates following the financial crisis and very-low levels of unemployment, inflation has remained persistently below their 2% target. Something has broken in the relationship. This is key, because it means that the Fed now feels free to keep interest rates exceptionally low in order to get employment back on track, without having to worry about inflation; and may in fact need to keep rates lower for longer in order to boost inflation. Both sides of the dual mandate now appear to require low rates. Chasing “maximum employment” With inflation no longer a priority for Fed officials at the moment, their sights are set squarely on achieving the maximum employment portion of the mandate. But what does it mean to achieve “maximum employment”? Well, it is an elusive target, but in general, it is the point at which rising wages leads to higher inflation – the result of businesses increasing pay to compete for a shrinking supply of workers. What is known is that even when the unemployment rate was at a 50-year low of 3.5% in early 2020, wages were not rising much. Which indicates that the economy may have been near maximum employment but was not quite there yet. So, to achieve maximum employment, unemployment needs to be somewhere near 3.5% and that could take some time, a long time. Current range estimates show the unemployment rate rising to anywhere between 12 – 30% in the coming months. And a recent report out of the Congressional Budget Office projected that unemployment will still be around 9.5% at the end of 2021. The last time the unemployment rate was at 9.5% was right after the financial crisis, and from that point it took nearly a decade for the rate to fall to 3.5%. And while it is not expected that the current crisis will be as prolonged as the previous one, it still provides a reference point as to how long it can take to recover job losses. So how long does the Fed expect to keep rates near zero? One year at the very minimum, easily two years, and perhaps up to a decade.

By: Kristan Frend I was recently pleased to see that the state I reside in, Minnesota finished in the bottom third of a state ranking. Luckily the rankings weren’t about overall health (#6), high school graduation (#3), or SAT scores (#2); instead it was the Federal Trade Commission’s state identity theft complaint ranks. Minnesota has just 49.2 complaints per 100,000 population, whereas the highest ranked state, Florida, as 114.8 complaints per 100,000 population. The top three states leading identity theft consumer complaints (per 100,000 population) included Florida, Arizona, and California. Besides warm sunshine and top-tier golf courses, what do these three states have in common? According to the February 2011 RealtyTrac U.S. Foreclosure Market Report™, all three rank in the top 5 states for foreclosure, and two of the three (Florida and California) rank #49 and #50 in unemployment rates, according to a March 2011 report released by the Bureau of Labor Statistics. On a national level unemployment rates and identity fraud incidence rates both improved from 2009 to 2010. From 2009 to 2010, unemployment rates went from 10.0% to 9.4% while according to Javelin’s 2010 Annual Identity Fraud Survey Report, identity fraud incidence rates fell from 4.8% to 3.5%. While it may be inaccurate to state that economic distress causes higher rates of identity fraud, there does seem to be a natural correlation between economic downswings and fraudulent activity. As we move further into 2011, it will be interesting to see if identity fraud incidence rates will continue to decrease as unemployment and economic outlook is on the upward swing.
By: Kari Michel As consumers and businesses continue to experience financial hardship, the likelihood of continued bankruptcy filings is fairly strong. Data from the Administrative Office of the U.S. Courts show there were 1,222,589 filings through September, versus 1,100,035 in the first nine months of 2009. According to American Bankruptcy Institute executive director Samuel J. Gerdano, "As the economy looks to climb out of the recent recession, businesses and consumers continue to file for bankruptcy to regain their financial footing. With unemployment hovering near 10% and access to credit remaining tight, total filings in 2010 will likely exceed 1.6 million." Given the bankruptcy trends, what can lenders do to protect themselves from acquiring consumers that are at risk for filing for bankruptcy? Bankruptcy scores are available, such as Bankruptcy PLUS, and are developed to accurately identify characteristics specific to a consumer filing for bankruptcy. Bankruptcy scores are typically used in conjunction with risk scores to set effective acquisition strategies. _________________ Source: http://www.collectionscreditrisk.com/news/bankruptcy-filings-up-3003998-1.html
With the news from the Federal Reserve that joblessness is not declining, and in fact is growing, a number of consumers are going to face newly difficult times and be further challenged to meet their credit obligations. Thinking about how this might impact the already struggling mortgage market, I’ve been considering what the impact of joblessness is on the incidence of strategic default and the resulting risk management issues for lenders. Using the definitions from our previous studies on strategic default, I think it’s quite clear that increased joblessness will definitely increase the number of ‘cash-flow managers’ and ‘distressed borrowers’, as newly jobless consumers face reduced income and struggle to pay their bills. But, will a loss of income also mean that people become more likely to strategically default? By definition, the answer is no – a strategic defaulter has the capacity to pay, but chooses not to, mostly due to their equity position in the home. But, I can’t help but consider a consumer who is 20% underwater, but making payments when employed, deciding that the same 20% that used to be acceptable to bear, is now illogical and will simply choose to stop payment? Although only a short-term fix, since they can use far less of their savings by simply ceasing to pay their mortgage, this would free up significant cash (or savings) for paying car loans, credit cards, college loans, etc; and yet, this practice would maintain the profile of a strategic defaulter. While it’s impossible to predict the true impact of joblessness, I would submit that beyond assessing credit risk, lenders need to consider that the definition of strategic default may contain a number of unique, and certainly evolving consumer risk segments. __________________________ http://money.cnn.com/2010/08/19/news/economy/initial_claims/index.htm
With the recent release of first-time unemployment applications by the Labor Department showing weaker than expected results, it comes as no surprise that July foreclosure rates also reflect the on-going stress being experienced by consumers across the nation. When considering credit score trends and delinquency measures across credit products, it’s interesting to see how these trends appear to be playing out in terms of their impact on consumer score migration patterns. Over the past year or so, it appears that the impact of a struggling economy is the creation of a two-tier consumer credit system. On one hand, for consumers with stronger credit risk scores who are able to successfully manage their financial obligations, we see stability in the composition of the prime and super-prime population. On the other hand, as other consumers face challenging times, especially through joblessness and reductions in real-estate equity, there are consumers who experience significant credit management issues and subsequently, their risk scores decline. The interesting phenomenon is that there seems to be fewer and fewer consumers who remain in between these two segments. Credit score migration patterns suggest the evolution of two distinct consumer populations: a relatively stable, lower-risk segment, and a somewhat bottom-heavy higher-risk population, comprised of consumers with long-term repayment challenges, recent foreclosures, repossessions and higher delinquency rates. Clearly, this type of change in score distribution directly impacts lenders and their acquisition and account management strategies. With few signs of a pending economic recovery, it will be interesting to watch this pattern develop in the long-term to see if the chasm between these groups becomes wider and more measurable, or whether other economic influences will further transform the consumer credit landscape.