Loading...

The AutoCheck Score Has a Whole New Look

Published: September 16, 2019 by Kirsten Von Busch

Introducing the newly designed AutoCheck Score™

Quickly compare and select used vehicles

As an auto industry professional, you use vehicle history reports every day. But they’re long, complex — easily misinterpreted. You always aim to conduct a thorough inspection. But what if you’re at a busy auction house or browsing online, where there’s simply not enough time or context?

The tool you use every day to make critical decisions about used vehicles should be accurate and easy to understand — built for streamlined evaluation. So we made one.

New look, same impact

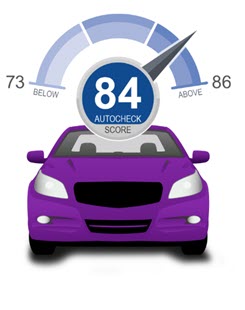
We’ve revamped the AutoCheck score with a modern look and feel that’s easier than ever to read. And it’s still invaluable for quickly comparing and selecting used vehicles. What, exactly, is it? Experian® analyzes the detailed records in an AutoCheck® vehicle history report to generate the AutoCheck Score.

Like a credit score or gas mileage rating for new vehicles, it’s a single number on a standardized scale. The new gauge shows the score range (from 1 – 100) for vehicles of similar age in the same class. If a car is above average in its range, you can feel confident that it’s a solid investment.

The score makes it much simpler to assess how a used vehicle measures up, estimating its:

  • Overall roadworthiness
  • Reliability compared to other vehicles in its class
  • Likelihood of being on the road in five years

It is invaluable for making informed decisions, managing inventory, mitigating risk and instilling confidence in customers.

Bigger, better

You can depend on the AutoCheck Score to deliver a high-quality, more accurate assessment. That’s because it’s derived from Experian’s world-class, continually updated database, which leverages reliable information from extensive sources, including:

  • Tens of thousands of distinct accident sources, many exclusive to Experian
  • 95% of U.S. auction houses — most providing structural damage, salvage-and-junk and export-data announcements exclusively to Experian
  • Important OEM safety and open recall data
  • State departments of motor vehicles and departments of public safety, insurance companies and other independent sources
  • Police department/state agency accident information from all 50 states and Washington D.C.
  • Federal sources, like import records

That’s a lot of data. And some complex statistical modeling. Don’t worry; we’ll take care of the heavy lifting. All you have to do is keep score.

Why you need it

Whether you’re a dealer, lender, manufacturer certified pre-owned program or consumer portal, the score will transform the way you do business to boost your bottom line.

Dealers: Use the score to mitigate risk, manage and market your inventory, close sales faster and build customer loyalty.

Lenders/Credit Unions: Use the score to more accurately estimate a vehicle’s value at every stage of the loan life cycle, from origination to portfolio review, account management and asset collection.

Manufacturer Certified Pre-Owned Programs: Use the AutoCheck report for vehicle certification.

Consumer Portals: Increase customer satisfaction — and traffic — by allowing OEMs and dealers to post the score with their listings and make online car shopping a breeze.

Count on the AutoCheck Score

To learn more about the score — or how to wield its power to maximal effect — find its secrets in this treasure trove of a white paper or call 1 888 675 5596.

 What are you waiting for? Redesign your business with the redesigned score.

Related Posts

With the National Automobile Dealers Association (NADA) Show set to kickoff later this week, it seemed fitting to explore how the shifting dynamics of the used vehicle market might impact dealers and buyers over the coming year. Shedding light on some of the registration and finance trends, as well as purchasing behaviors, can help dealers and manufacturers stay ahead of the curve. And just like that, the Special Report: Automotive Consumer Trends Report was born. As I was sifting through the data, one of the trends that stood out to me was the neck-and-neck race between Millennials and Gen X for supremacy in the used vehicle market. Five years ago, in 2019, Millennials were responsible for 33.3% of used retail registrations, followed by Gen X (29.5%) and Baby Boomers (26.8%). Since then, Baby Boomers have gradually fallen off, and Gen X continues to close the already minuscule gap. Through October 2024, Millennials accounted for 31.6%, while Gen X accounted for 30.4%. But trends can turn on a dime if the last year offers any indication. Over the last rolling 12 months (October 2023-October 2024), Gen X (31.4%) accounted for the majority of used vehicle registrations compared to Millennials (30.9%). Of course, the data is still close, and what 2025 holds is anyone’s guess, but understanding even the smallest changes in market share and consumer purchasing behaviors can help dealers and manufacturers adapt and navigate the road ahead. Although there are similarities between Millennials and Gen X, there are drastic differences, including motivations and preferences. Dealers and manufacturers should engage them on a generational level. What are they buying? Some of the data might not come as a surprise but it’s a good reminder that consumers are in different phases of life, meaning priorities change. Over the last rolling 12 months, Millennials over-indexed on used vans, accounting for more than one-third of registrations. Meanwhile, Gen X over-indexed on used trucks, making up nearly one-third of registrations, and Gen Z over-indexed on cars (accounting for 17.1% of used car registrations compared to 14.6% of overall used vehicle registrations). This isn’t surprising. Many Millennials have young families and may need extra space and functionality, while Gen Xers might prefer the versatility of the pickup truck—the ability to use it for work and personal use. On the other hand, Gen Zers are still early in their careers and gravitate towards the affordability and efficiency of smaller cars. Interestingly, although used electric vehicles only make up a small portion of used retail registrations (less than 1%), Millennials made up nearly 40% over the last rolling 12 months, followed by Gen X (32.2%) and Baby Boomers (15.8%). The market at a bird’s eye view Pulling back a bit on the used vehicle landscape, over the last rolling 12 months, CUVs/SUVs (38.9%) and cars (36.6%) accounted for the majority of used retail registrations. And nearly nine-in-ten used registrations were non-luxury vehicles. What’s more, ICE vehicles made up 88.5% of used retail registrations over the same period, while alternative-fuel vehicles (not including BEVs) made up 10.7% and electric vehicles made up 0.8%. At the finance level, we’re seeing the market shift ever so slightly. Since the beginning of the pandemic, one of the constant narratives in the industry has been the rising cost of owning a vehicle, both new and used. And while the average loan amount for a used non-luxury vehicle has gone up over the past five years, we’re seeing a gradual decline since 2022. In 2019, the average loan amount was $22,636 and spiked $29,983 in 2022. In 2024, the average loan amount reached $28,895. Much of the decline in average loan amounts can be attributed to the resurgence of new vehicle inventory, which has resulted in lower used values. With new leasing climbing over the past several quarters, we may see more late-model used inventory hit the market in the next few years, which will most certainly impact used financing. The used market moving forward Relying on historical data and trends can help dealers and manufacturers prepare and navigate the road ahead. Used vehicles will always fit the need for shoppers looking for their next vehicle; understanding some market trends will help ensure dealers and manufacturers can be at the forefront of helping those shoppers. For more information on the Special Report: Automotive Consumer Trends Report, visit Experian booth #627 at the NADA Show in New Orleans, January 23-26.

Published: January 21, 2025 by Kirsten Von Busch

The automotive industry is constantly changing. Shifting consumer demands and preferences, as well as dynamic economic factors, make the need for data-driven insights more important than ever. As we head into the National Automobile Dealers Association (NADA) Show this week, we wanted to explore some of the trends in the used vehicle market in our Special Report: State of the Automotive Finance Market Report. Packed with valuable insights and the latest trends, we’ll take a deep dive into the multi-faceted used vehicle market and better understand how consumers are financing used vehicles. 9+ model years grow Although late-model vehicles tend to represent much of the used vehicle finance market, we were surprised by the gradual growth of 9+ model year (MY) vehicles. In 2019, 9+MY vehicles accounted for 26.6% of the used vehicle sales. Since then, we’ve seen year-over-year growth, culminating with 9+MY vehicles making up a little more than 30% of used vehicle sales in 2024. Perhaps more interesting though, is who is financing these vehicles. Five years ago, prime and super prime borrowers represented 42.5% of 9+MY vehicles, however, in 2024, those consumers accounted for nearly 54% of 9+MY originations. Among the more popular 9+MY segments, CUVs and SUVs comprised 36.9% of sales in 2024, up from 35.2% in 2023, while cars went from 44.3% to 42.9% year-over-year and pickup trucks decreased from 15.9% to 15.6%. 2024 highlights by used vehicle age group To get a better sense of the overall used market, the segments were broken down into three age groups—9+MY, 4-8MY, and current +3MY—and to no surprise, the finance attributes vary widely. While we’ve seen the return of new vehicle inventory drive used vehicle values lower, it could be a sign that consumers are continuing to seek out affordable options that fit their lifestyle. In fact, the average loan amount for a 9+MY vehicle was $19,376 in 2024, compared to $24,198 for a vehicle between 4-8 years old and $32,381 for +3MY vehicle. Plus, more than 55% of 9+MY vehicles have monthly payments under $400. That’s not an insignificant number for people shopping with the monthly payment in mind. In 2024, the average monthly payment for a used vehicle that falls under current+3MY was $608. Meanwhile, 4-8MY vehicles came in at an average monthly payment of $498, and 9+MY vehicles had a $431 monthly payment. Taking a deeper dive into average loan amounts based on specific vehicle types—as of 2024, current +3MY cars came in at $28,721, followed by CUVs/SUVs ($31,589) and pickup trucks ($40,618). As for 4-8MY vehicles, cars came in with a loan amount of $22,013, CUVs/SUVs were at $23,133, and pickup trucks at $31,114. Used 9+MY cars had a loan amount of $19,506, CUVs/SUVs came in at $17,350, and pickup trucks at $22,369. With interest rates remaining top of mind for most consumers as we’ve seen them increase in recent years, understanding the growth from 2019-2024 can give a holistic picture of how the market has shifted over time. For instance, the average interest rate for a used current+3MY vehicle was 8.0% in 2019 and grew to 10.2% in 2024, the average rate for a 4-8MY vehicle went from 10.3% to 12.9%, and the average rate for a 9+MY vehicle increased from 11.4% to 13.8% in the same time frame. Looking ahead to the used vehicle market It’s important for automotive professionals to understand and leverage the data of the used market as it can provide valuable insights into trending consumer behavior and pricing patterns. While we don’t exactly know where the market will stand in a few years—adapting strategies based on historical data and anticipating shifts can help professionals better prepare for both challenges and opportunities in the future. As used vehicles remain a staple piece of the automotive industry, making informed decisions and optimizing inventory management will ensure agility as the market continues to shift. For more information, visit us at the Experian booth (#627) during the NADA Show in New Orleans from January 23-26.

Published: January 21, 2025 by Melinda Zabritski

Quick Answer: A new consumer survey reveals that 90% of survey respondents would like to have more than one Vehicle History Report when shopping for a used car. Offering an Experian AutoCheck® VHR as a second Vehicle History Report is a smart, simple strategy to help you close more deals.   In today’s used car market, standing out from the crowd is more important than ever. As buyers become savvier and more informed, dealerships need to find new ways to build trust and close sales. One simple yet effective strategy? Offering a second Vehicle History Report (VHR) to your customers. Why VHRs Matter So Much Let’s face it—buying a car is a big deal. Most people don’t just walk onto a lot and pick the first car they see. They do their homework, and a big part of that research involves Vehicle History Reports. In fact, a recent survey found that 70% of people used a VHR the last time they bought a car. And it’s not just a one-time thing—83% of buyers say they’ll use a VHR for their next purchase too. Why? Because these reports provide crucial details like accident history, mileage accuracy, and service records that give buyers confidence in their decisions. The Case for Offering Multiple VHRs Here’s something that might surprise you: 90% of surveyed car buyers said they’d like to see more than one VHR when shopping for a used car. Think about that for a second. People want that extra layer of reassurance that only comes from cross-checking information. This is especially true for those who prefer buying from dealerships—these customers expect comprehensive, reliable data before they make a decision. How Multiple VHRs Can Give Your Dealership an Edge So, what’s the big deal about offering more than one VHR? It’s all about trust and transparency. Just like banks look at multiple credit reports before approving a loan, offering multiple VHRs can help you provide a fuller, more accurate picture of a vehicle’s history. This can reduce your liability and protect your dealership’s reputation. We have done some digging into this, and the results are eye-opening. For instance, in one case study, a dealership found additional damage events through an Experian AutoCheck® VHR that weren’t picked up by other VHRs. This kind of discrepancy shows just how valuable it can be to provide that second report—it helps ensure that all the facts are on the table, which protects both you and your customers. Meeting and Exceeding Customer Expectations Here’s something else to keep in mind: people expect dealerships to go the extra mile. The survey found that 86% of used car buyers believe VHRs should be provided for free by the dealership. By offering multiple reports at no additional cost, you’re not just meeting their expectations—you’re exceeding them. And that’s a surefire way to boost customer confidence, satisfaction, and, ultimately, your sales. What You Can Do Today Offering a second Vehicle History Report is a smart, simple strategy to help you close more deals. It shows your customers that you’re committed to transparency and that you care about providing them with all the information they need to make a confident decision. In a competitive market, it’s the little things like this that can make a big difference. Your customers—and your bottom line—will thank you. Experian Automotive is here to help you with your vehicle history data needs.  If you’d like to learn more about our AutoCheck solution and how we can support you, click below to have someone from our team contact you.

Published: September 16, 2024 by Kirsten Von Busch

Subscribe to our Auto blog

Enter your name and email for the latest updates.

This site is protected by reCAPTCHA and the Google Privacy Policy and Terms of Service apply.